
Economic Perspectives June 2024
Read the full publication below or click here to open the PDF.
- As geopolitical concerns about a wider-spread conflict in the Middle East moved to the background for markets, oil prices declined last month. The OPEC+ announcement to extend supply cuts until the end of next year did little to reverse this trend. On the contrary, as voluntary supply cuts will be phased out from October onwards and non-OPEC+ supply keeps growing rapidly, the market is expected to remain well-supplied. Contrary to oil prices, European natural gas prices rose in May and this due to operational problems in Norway, Europe’s biggest supplier.
- The fight against inflation in the euro area is far from over. In May, headline inflation increased from 2.4% to 2.6%, as year-on-year energy inflation turned positive again while food inflation slightly declined. Core inflation also increased from 2.7% to 2.9%, mostly due to a big increase in services inflation. Goods inflation remains moderate. We upgrade our 2024 forecast from 2.5% to 2.6% and our 2025 forecast from 2% to 2.3%.
- US inflation cooled in May. Headline inflation declined more than expected to 3.3% last month, while core inflation reached 3.4%. Within non-core components, food price inflation was moderate while energy prices dropped by 2% month-over-month. Core goods prices were unchanged last month, as were core service prices (ex. shelter). Only shelter price inflation remained elevated and sticky. We downgrade our 2024 forecast from 3.3% to 3.1% and our 2025 forecast from 2.5% to 2.4%.
- The major central banks have struck more hawkish tones lately. The ECB may have started its rate cut cycle in June, but by raising its inflation expectations, it suggested that the pace of the rate cut cycle could be slow. We expect two further rate cuts this year. The Fed was even more hawkish. Notwithstanding a favourable May CPI print, the Fed raised its inflation forecast and signaled only one rate cut this year. We expect softer data to allow the Fed to move somewhat faster and to cut rates twice this year.
- The euro area economy is on a slow path to recovery. Q1 GDP growth was relatively strong thanks to elevated net exports. Producer confidence indicators are also improving, especially in the services sector, and consumer confidence is recovering, though savings rates still remain too high for a fast recovery. Unfortunately, gross fixed capital formation remains sluggish. Political risks also resurfaced as President Macron announced new parliamentary elections in France, driving up spreads. We maintain our 2024 and 2025 growth forecasts of 0.7% and 1.3% respectively.
- The US economy is showing first signs of weakening. Q1 quarterly GDP growth was revised lower from 0.4% to 0.3% mainly due to lower consumer spending. The latter remained weak in April, as savings buffers are gradually exhausted. There were also signs of easing in the labour market with the unemployment rate increasing and the participation rate and job openings declining. We lower both our 2024 and 2025 forecasts by 0.1 percentage points to 2.2% and 1.7%, respectively.
- The macroeconomic situation and outlook remain largely unchanged in China as recent data on industrial production, retail sales and the real estate sector suggest neither major improvements in the many headwinds weighing on growth, nor any signs of further deterioration in momentum. We maintain our growth outlook of 5.1% for 2024.
The latest data show that the world economy is converging again. The euro area is gradually recovering as confidence indicators are improving and net exports are booming. In contrast, the booming US economy is showing first signs of softening. Consumers are losing their confidence and the labor market is gradually becoming less tight. A soft landing is still in the cards.
The Chinese economy is also showing signs of weakening. Domestic demand remains subdued as real estate prices continue their descent and consumer confidence remains low. Meanwhile, external headwinds strengthen, as foreign investments are falling fast and major trading partners raise tariffs on a.o. Chinese green and high tech imports.
On the inflation front, the euro area and the US converged marginally. Stronger services inflation pushed up euro area core inflation to 2.9% in May, while flat core goods and services prices (ex. shelter) pushed down core inflation in the US to 3.4%.
Central banks in both regions have also been striking more hawkish tones lately, by raising their inflation forecasts and tempering expectations of rate cuts this year.
Oil prices decline despite OPEC+ supply cuts
Oil prices continued their descent in May on the back of easing Israel-Iran tensions. The price per barrel declined 3% last month to 81 USD. The decision of OPEC+ to extend the supply reductions of 3.6 million barrels per day in total until the end of next year did little to reverse this trend. On the contrary, as the cartel is now set to gradually unwind the extra 2.2 million barrels in voluntary cuts from October onwards, markets expect ample oil supply. Furthermore, tensions are rising within the cartel as several members are currently overshooting their targets. In April, cartel members overshot their targets by 500 thousand barrels per day. Iraq and Kazakhstan are the worst offenders, but Russia is also overshooting its target as it needs funding for its war. Meanwhile, non-OPEC production keeps rising steadily. This is especially the case in North America where US shale oil is being produced at record-high levels. The recent completion of a major oil pipeline in Canada will further drive up North American oil supply.
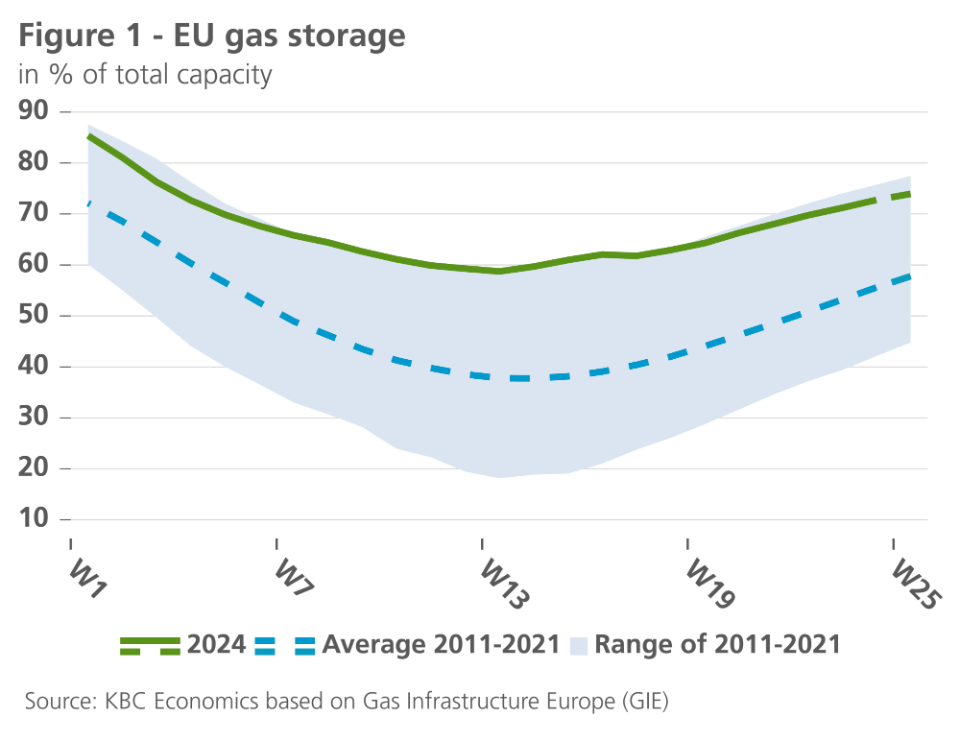
Contrary to oil prices, gas prices have been on the rise in the last few weeks. Prices rose 10% in May to 34 EUR per MWh and continued to increase in June. The rise is caused by major operational problems in Norwegian processing plants. Since Russia cut off most gas supplies to Europe, Norway has become Europe’s biggest gas supplier. That said, sky-high EU gas reserves are providing a solid buffer to withstand temporary supply cuts (see figure 1).
Euro area inflation slightly higher
Euro area inflation rose to 2.6% in May, 0.2 percentage points higher than in April. Core inflation increased to 2.9% from 2.7%, the same level as in March 2024. The higher core inflation was driven solely by services inflation, which rose from 3.7% in April to 4.1% in May, while non-energy goods inflation decreased slightly from 0.9% to 0.8%. The annual rate of increase in energy prices turned positive again for the first time since April 2023 (0.3%), while food price inflation declined again to 2.6% after the small rebound in April 2024.
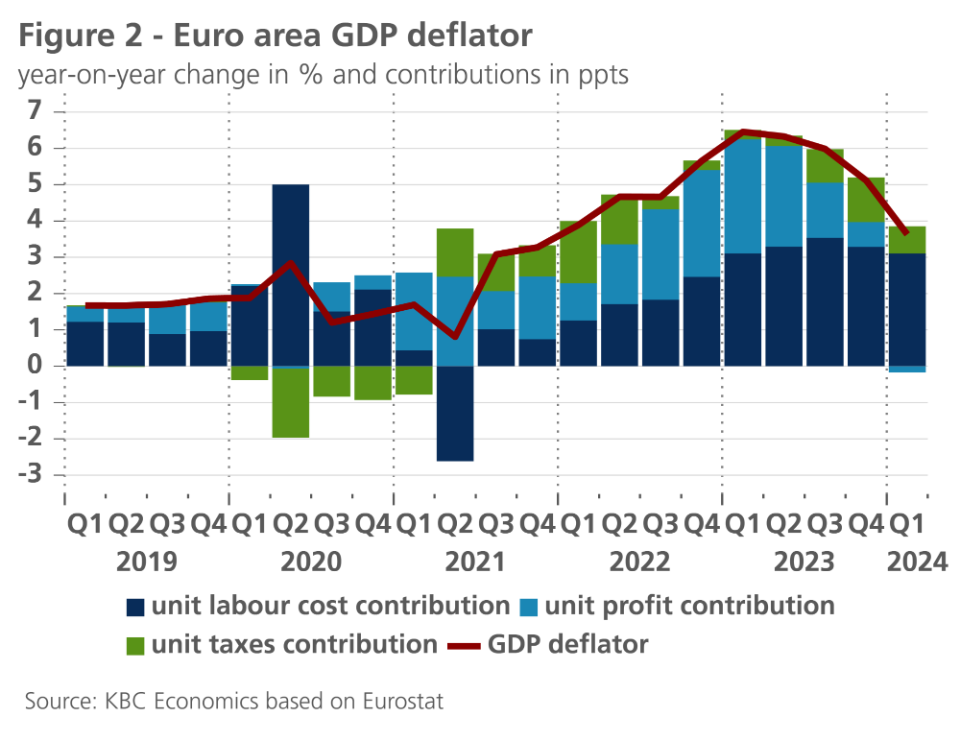
The slight increase in core inflation confirms that the fundamentally downward trend in inflation is on a bumpy path. Persistent services inflation is the main cause of the slow inflation deceleration. Indeed, services inflation continues to be fueled by wages catching up with past very high inflation. This catch-up effect is reflected in the acceleration of wage growth as measured by the ECB's indicator on negotiated wages: from 4.5% in Q4 2023 to 4.7% in Q1 2024. Especially against the backdrop of declining productivity - a consequence of employment growth outstripping GDP growth - such wage growth is too high to bring inflation sustainably to 2%. That said, wage growth is not derailing. Moreover, productivity growth is expected to improve as the economic recovery gains momentum. And in the meantime - as expected - wage cost pressures are partly absorbed by companies' profit margins. This is evident from the analysis of the GDP deflator relating to the first quarter of 2024 (see figure 2).
All this implies that our scenario of persistent, yet gradually cooling core inflation is basically confirmed, although the bumpy nature of inflation lifts the path slightly higher. We therefore raised our estimate for expected average inflation from 2.5% to 2.6% for 2024 and from 2.0% to 2.3% for 2025.
US inflation cools
US inflation declined from 3.4% to 3.3% as prices stayed flat last month. Core inflation declined from 3.6% to 3.4% and was only 0.16% on a month-on-month basis.
This downside surprise was broad-based. There was a big drop in energy prices of 2% month-on-month, thanks to lower gasoline prices, while food prices showed only a minimal increase. Within core components, goods prices stayed flat last month as new vehicle and apparel prices declined. Surprisingly, used car and truck prices increased by 0.6% month-over-month. Forward-looking indicators suggest this component is likely to fall in the coming months.
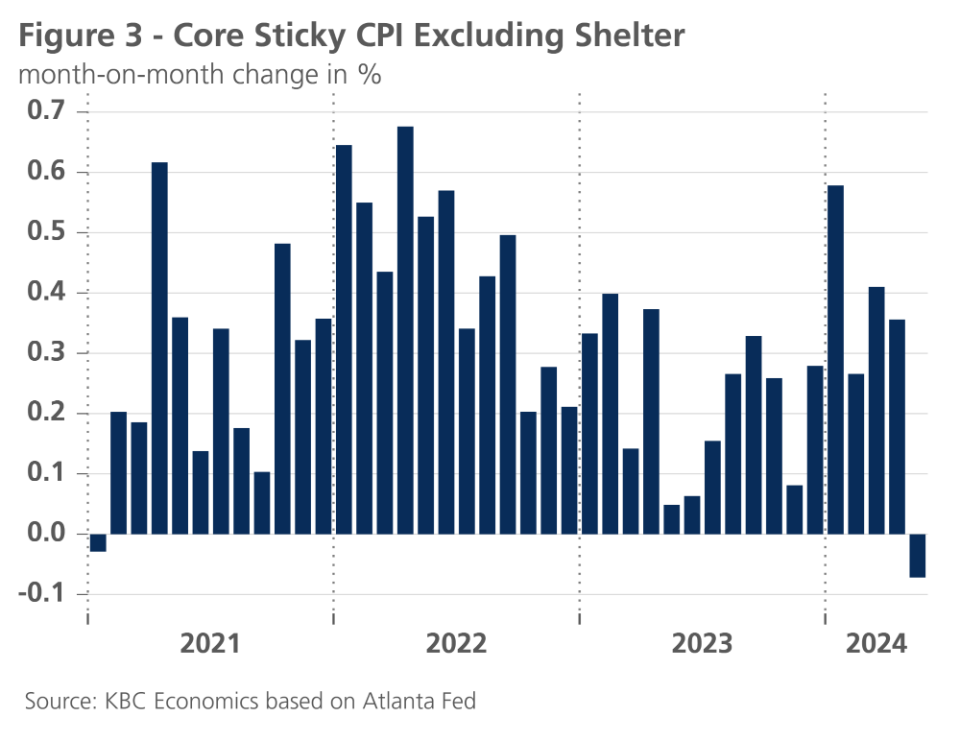
The most disinflationary surprise came from core services (ex. shelter), which stayed flat month-over-month. Though part of this downward surprise can be explained by some big declines in more volatile components (such as airlines fares), other stickier components also showed declines. As a result, the core sticky CPI (ex. shelter) weakened for the first time in three years (January 2021, see figure 3).
Whether this low service inflation can be maintained, remains to be seen. The wage evolution was unfavourable last month as average hourly earnings rose 0.4% on a monthly basis. We could see softer wage increases in the coming months, however, as the May figure was boosted by a minimum wage increase in California. Furthermore, higher unemployment and lower job openings suggest that the labour market is becoming less tight, which could lower wage growth.
Also, motor vehicle insurance prices declined for the first time since 2021. This might be the start of a new trend, as vehicle insurance tends to follow vehicle prices with a lag and vehicle prices have been declining since early 2022.
The only dissonant in the May inflation figures was shelter price inflation, which remained elevated at 0.4% month-on-month. Lower market rent inflation and the softening of house price inflation could lower shelter inflation in the coming months. Unfortunately, shelter prices take time to react to these impulses.
Given the major downside inflation surprise (especially for services), we downgraded our 2024 forecast from 3.3% to 3.1%, while downgrading our 2025 forecast from 2.5% to 2.4%.
ECB kicks off rate-cutting cycle, but Fed is not following (yet)
On 6 June 2024, the ECB decided for the first time since September 2019 (when the ECB brought its deposit rate to an all-time low of -0.5%) to cut its three policy rates by 25 basis points each. This decision brought the deposit rate to 3.75% from its cyclical peak of 4%, which had been in place since September 2023.
For the remainder of 2024, KBC Economics expects another rate cut of 25 basis points in September and another one (also of 25 basis points) by the end of 2024, bringing the ECB’s deposit rate to 3.25% at the end of 2024. At that point, the deposit rate would still be well above any reasonable estimate of what a euro (nominal) neutral rate might be (KBC’s current estimate is in the range between 2.50% and 2.75%). This restrictive stance is appropriate given the above-target (underlying) inflation and the uncertainties (‘bumps’) that still lie ahead. As progress is made on the disinflationary path, we expect the policy rate to be reduced further, gradually approaching the neutral rate by the end of 2025. A soft landing in 2025 seems in the making.
However, risks of a somewhat slower easing pace remain material. The ECB’s rate cut was widely expected, not in the least because of the recent, a-typical explicit forward guidance of ECB governors. Against this backdrop, the ECB refused to explicitly commit on any kind of specific further rate-cutting path. The ECB wants to keep its options open and underscored (again) that it is fully data dependent with decisions made on a meeting-by-meeting basis. Nevertheless, during the press conference, ECB president Lagarde mentioned that there was a strong likelihood that the ECB has now entered into a “dialing back phase”, after the previous phase of policy tightening followed by a period of holding rates steady (referring to terminology she used in a previous speech).
With its latest rate decision, the ECB took a lead over the Fed. For the time being, the Fed is still hesitating and therefore decided to keep the policy rate unchanged in June. It communicated that, at this stage, it is not convinced that a rate cut would be appropriate. Reasons for this include the stickiness of the disinflationary path of (core) inflation until April (i.e. before the dovish inflation surprise in May), the upgrade of the Fed’s own inflation forecasts for 2024 and the Fed’s robust view on the strength of the US labour market. The Fed expects the unemployment rate to be 4% at the end of 2024. As this is also the current level, this assumes no further softening of the labour market at all, which is overly optimistic in our view. Together with our more favourable disinflationary view, we continue to expect two Fed rate cuts this year (in line with the market view), despite the Fed’s suggestion of only one rate cut in 2024.
Risk aversion on bond markets
On balance, US and German 10-year government bond yields fell (while the US dollar appreciated) as a result of a sharp increase in risk aversion after the European election and the French President’s decision to call a snap parliamentary election on 30 June and 7 July. Intra-EMU sovereign spreads rose markedly, particularly for teh more fiscally vulnerable member states. We expect the political uncertainty and risk aversion to persist for the next couple of months, with spreads elevated at levels even slightly higher than the current ones. Despite these tweaks, we are still working under the assumption that all EU national governments, including the next French one, will eventually reach an agreement with the European Commission with respect to the SGP implementation and the 2025 budget discussion. As a result, we expect spreads to ease again towards the end of 2024.
For a couple of EMU countries with better country-specific macro fundamentals compared to Germany (including Italy, Spain, Portugal and Belgium), we have slightly lowered the expected medium-term spread level. In order to reflect the specific political situation in France, we have raised its expected medium-term spread level slightly to 75 basis points.
Growth contribution of consumption in euro area still modest for now
Figures on the evolution of spending components in the first quarter of 2024 confirm that in the main euro area countries, net exports made a significant contribution to real GDP growth (see figure 4).
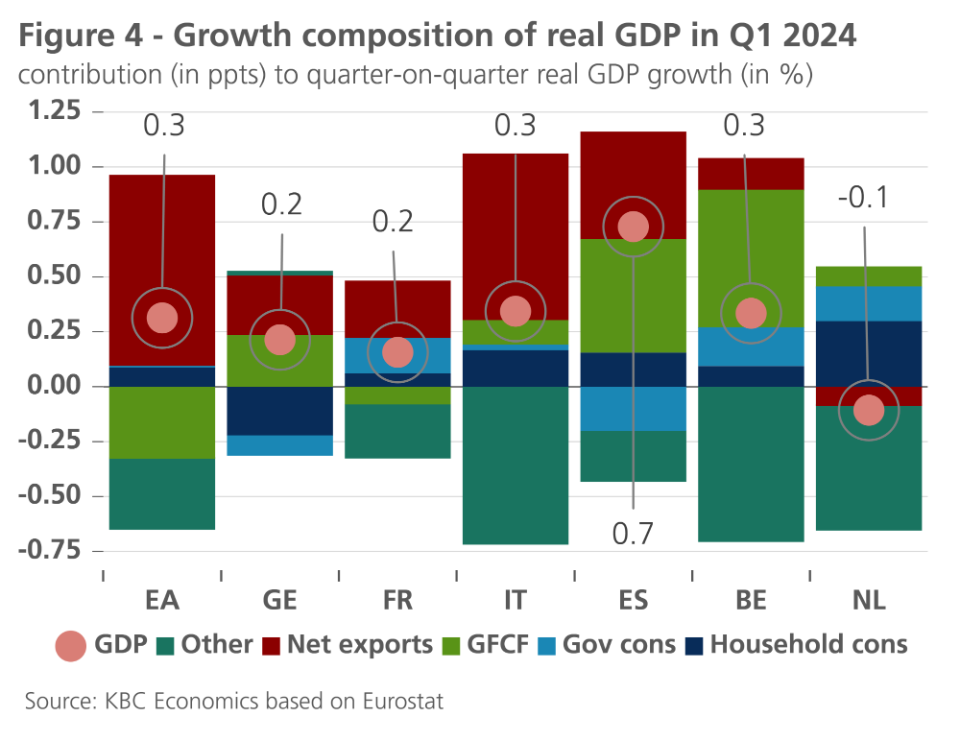
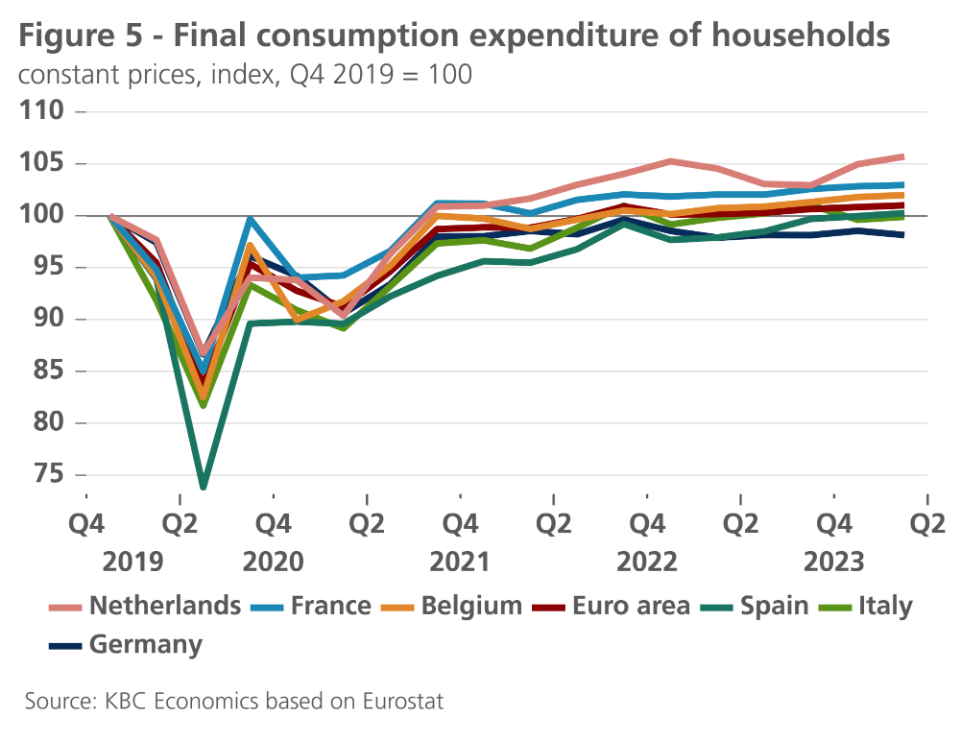
Only in the Netherlands - the only large(r) euro area country where real GDP still recorded a small contraction of 0.1% compared to the last quarter of 2023 - this was not the case. There, private consumption made a remarkably strong growth contribution compared to the other large(r) euro area countries. At the beginning of 2024, real household consumption in the Netherlands was more than 5% above the pre-pandemic level at the end of 2019, the strongest increase among all large(r) euro area countries (see figure 5). This relatively strong growth was made possible because real disposable household income was estimated by the European Commission to have increased by 8% in 2023 versus 2019, the strongest increase among the countries considered, followed by Belgium with a 5% increase.
In the other large(r) euro area countries, the growth contribution of private consumption remained more modest in the first quarter of 2024, and in Germany it was even negative. German consumers thus remain hapless: their spending volume was still almost 2% lower in the first quarter of 2024 than in the fourth quarter of 2019 (see figure 5). The primary causes are a relatively limited increase in real disposable household income and - above all - weak confidence that makes German consumers save more. The stronger-than-expected growth of the German economy in the first quarter was mainly due to the positive growth contribution of net exports and investment. The latter recovered somewhat, following the decline in the fourth quarter.
We expect private consumption to become a more dominant driver of economic growth in the euro area in the coming months. The slightly stronger increase in the pace of negotiated wage growth for the first quarter of 2024 (a year-on-year increase of 4.7% in the first quarter of 2024 versus 4.5% in the last quarter of 2023) confirms that the catch-up of wages to the past inflation upsurge is ongoing. This continues to support the purchasing power growth of wages. Meanwhile, employment also continues to grow, and the euro area unemployment rate fell to a new historic low (6.4% of the labour force) in April. The economic conditions for a recovery of confidence and consequently consumption thus remain in place, although political uncertainty and the prospect of austerity measures due to the consolidation of public finances in several European countries may dampen that recovery somewhat.
Recent indicators confirm that consumer and business confidence is bottoming out, with several signs of improvement. Our scenario also assumes that the restrictive impact of fiscal policy will remain limited and will not be an insurmountable obstacle to the economic recovery. Compared to the drastic cuts following the euro debt crisis of (over) a decade ago, fiscal consolidation is now allowed to be spread over time and, in a number of countries, it will also be tempered somewhat by European-funded investment (NGEU). Some decline in the household savings ratio, which has risen slightly again in 2023 and is still significantly above pre-pandemic levels, may also contribute to the further firming of household consumption.
We have therefore left our expectations for quarterly real GDP growth in the next few quarters unchanged. We also maintain the expected average annual growth rate of real GDP in the euro area at 0.7% for 2024 and at 1.3% for 2025.
US economy softens
US Q1 GDP was revised downwards from 0.4% to 0.3% quarter-on-quarter. The revision was mostly due to a downward revision of consumer spending, particularly in durable goods. Consumer spending has been weakening in this quarter too. Real personal consumption expenditures declined by 0.1% in April. With the savings rate at a low 3.6%, consumers are eating away their pandemic-era savings buffers. Rising interest rates are also increasingly hurting consumers. Consumer loan delinquency rates have risen to levels not seen since 2012.
Internal demand aside, the US economy is also suffering from low external demand, given the economic weakness of external trading partners and the strong US dollar. The trade deficit widened again in April. Net exports could thus again contribute negatively to US GDP growth this quarter.
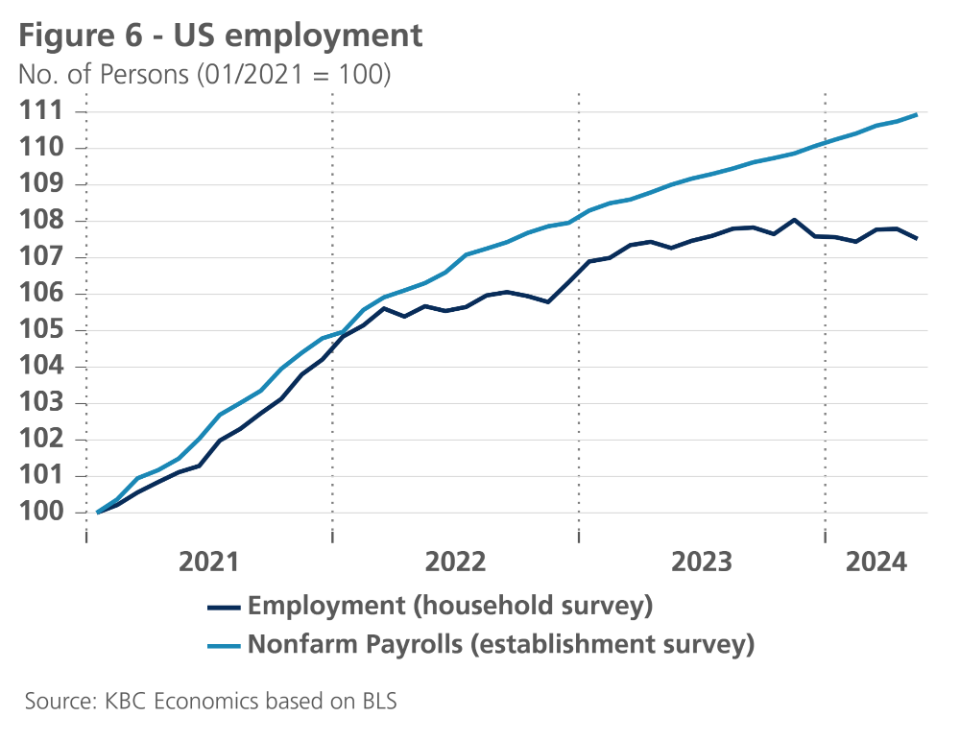
Signs of softening were also visible in the labour market. The unemployment rate increased from 3.9% to 4%, while the participation rate decreased from 62.7% to 62.5%. Job openings dropped by 296k in April to 8.06 million, the lowest level since February 2021. Employment figures in the labour market report also showed some dissonance. While the establishment survey (which surveys businesses) indicated that 272k jobs were added in May, the household survey (which surveys individuals) estimated a 408k decline in employment in May (see figure 6). The divergence between the two surveys that we have seen in recent years, can be explained by two factors. One is the surge in migration in recent years (which is poorly captured in the household survey). It is also likely, however, that the establishment survey is somewhat overstating the pace of job growth.
In contrast to most hard data, confidence indicators improved overall in May. This was especially the case for the business confidence indicators in the services sectors. That said, confidence indicators have been less reliable as economic predictors since the pandemic.
All in all, given the weaker hard data, we lowered both our 2024 and 2025 forecasts by 0.1 percentage points to 2.2% and 1.7% respectively.
Real estate problems and rising trade tensions threaten Chinese growth
The macroeconomic situation and outlook remain largely unchanged in China as recent data suggest neither major improvements in the many headwinds weighing on growth, nor any signs of further deterioration in momentum. Industrial production in May eased to 0.3% month-over-month from 0.97% in April, leading to a still solid year-over-year figure of 5.6%. Meanwhile, retail sales surprised to the upside at 0.51% month-over-month in May (3.7% year-over-year) after nearly stagnating in April. The improvement in the retail sector is a welcome sign for an economy still struggling with extremely weak consumer confidence. That confidence won’t be helped by the latest data coming out of the real estate sector, which show prices falling 4.3% year-over-year in May and fixed-asset investment in real estate falling 8.6% in the first five months of 2024 relative to the same period in 2023. Exports remain a relative bright spot, growing 11.2% year-over-year in May. But trade tensions between China and its export destinations, particularly the US and the EU, are heating up, with the EU imposing new tariffs on electric vehicle imports from China last week and the US announcing new tariffs on a range of Chinese imports last month. As such, boosting domestic demand remains crucial for putting the Chinese economy back on a more sustainable track. We maintain our outlook for real GDP growth of 5.1% in 2024 and have marginally upgraded our 2025 outlook from 4.0% to 4.2%. This upward revision reflects a technical readjustment of our view on trend growth dynamics in China rather than any change to momentum or the current headwinds weighing on the economy.
All historical quotes/prices, statistics and charts are up-to-date, through 17 June 2024, unless otherwise stated. Positions and forecasts provided are those of 17 June 2024.