
Economic Perspectives June 2021

Read the full publication below or click here to open the PDF.
- Recent high frequency data suggest that the recovery across advanced economies is underway. Coupled with favourable developments on the virus and vaccination front, this reinforces our positive growth outlook, assuming that activity will accelerate further into the summer months. The recovery is nonetheless facing some headwinds, largely due to the bottleneck-related supply-side pressures. We maintain the view that these supply-side constraints are mostly transitory and will eventually abate as supply conditions improve without derailing the post-pandemic economic recovery.
- Although the first batch of Q2 hard data in the euro area came out somewhat mixed, buoyant May sentiment indicators bode well for underlying momentum. The latest business confidence gains suggest a pick-up in services and manufacturing activity, although the latter is constrained by widespread supply chain disruptions. We reiterate our view that the recovery should take off in the second quarter and gain momentum in the remainder of 2021 as more containment measures are rolled back and pent-up demand is released. All in all, we expect the euro area economy to expand by 4.1% in 2021 and 4.4% in 2022.
- The recovery in the US is already in full swing as suggested by the final release of Q1 GDP data. Recent business confidence indicators point to strong ongoing momentum, which is consistent with our view of strengthening real GDP growth in the second quarter. Despite impressive progress since the trough of the pandemic crisis, the labour market is experiencing a range of supply and demand issues, highlighted by a couple of disappointing jobs reports. Overall, we keep our US growth outlook for both 2021 and 2022 unchanged at 6.5% and 4.0%, respectively.
- Near-term inflationary pressures have strengthened significantly across the advanced economies. In the US, headline inflation continues to surprise to the upside and surged to the highest level since 2008, while price pressures in the euro area are also firming. Although it may likely take longer than initially expected for these pressures to clearly ease, we believe that inflation is currently mostly driven by transitory factors which are set to fade away gradually. Therefore, we do not anticipate spiralling inflation, yet the risks to inflation in the coming quarters are clearly tilted to the upside.
- The ECB kept an unchanged monetary policy stance at its June meeting, including a decision to continue the modestly increased pace of PEPP net purchases for the third quarter of 2021. We maintain the view that the ECB will conduct very easy monetary policy throughout our forecast horizon, supporting favourable financing conditions. Meanwhile, the Fed also left its very accommodative policy stance unchanged at its June meeting, but signalled that interest rates are set to increase earlier and faster than previously expected.
- On bond markets, sovereign yields in advanced economies have stabilised after the sharp spike earlier in the year, however, our outlook assumes some room for further upward movement in the remainder of 2021 and 2022. In currency markets, the US dollar has lost ground since early April, weakening above 1.20 EUR/USD. We are now pencilling in a much weaker trajectory for the greenback which is expected to depreciate to the level of 1.26 by the end of 2021 and 1.35 by end-2022.
Recent high frequency data suggest that the recovery across advanced economies is underway. Sentiment indicators continue to improve rapidly with consumer and business confidence surging to multi-year highs, suggesting that the euro area is on its way to join the US growth boom in the second quarter. At the same time, the latest business surveys signal a sectoral rotation with momentum in activity moving from manufacturing towards services. Service sector sentiment is catching up, buoyed by a roll-back of restrictions and a gradual reopening of economies, while business confidence in manufacturing remains elevated on both sides of the Atlantic amid strong growth in output and new orders.
Headwinds to the post-pandemic recovery
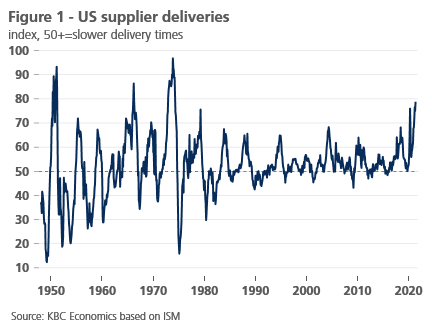
The latest data reinforce our optimistic growth outlook for the US and the euro area, assuming that activity will accelerate further into the summer months. The post-pandemic recovery is nonetheless facing some headwinds, largely due to bottleneck-related supply-side pressures (also see KBC Economic Opinion of 27 May). The strength in manufacturing continues to be accompanied by input shortages and rising production costs. Along with rising shipping costs, supplier delivery times have lengthened dramatically, reaching levels in the US last witnessed in the 1970s (figure 1). Moreover, the global chip shortage is affecting production in several sectors, highlighting industry’s reliance on a small group of semiconductors manufacturers. The combination of surging input prices and healthy demand conditions is leading to a pick-up in output prices, fuelling inflationary pressures across the advanced economies.
These headwinds, however, do not materially change our assessment of the economic outlook. Admittedly, with buoyant growth in final goods demand, it is unlikely that supply disruptions will be alleviated quickly and may result in speed bumps in the post-pandemic recovery phase. Still, we maintain the view that these supply-side constraints are mostly transitory and will eventually abate as supply conditions improve without derailing the economic recovery. A demand shift from goods to services should also help narrow demand-supply imbalances somewhat as economies continue to reopen.
Vaccination progress coupled with downside risks
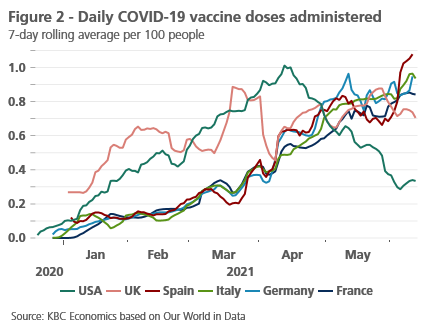
Furthermore, the situation on the virus front is improving rapidly with infection rates down markedly from their early 2021 peaks. This is consistent with a significant effect from the vaccination campaigns: the US has now vaccinated more than half of the population (with at least one dose), while the euro area ‘big four’ countries are only a tad behind thanks to the recent step-up in the vaccination effort. In fact, the major euro area countries are now vaccinating at a pace higher than that achieved at any point by the United Kingdom and only slightly below the peak briefly reached by the US in April (figure 2). Against this background, we expect that the gradual easing of restrictions will continue over the summer months, setting the stage for a sustained normalisation in economic activity.
Although a good proportion of the population has been vaccinated in Europe, there remains considerable uncertainty around the spread of the virus. The biggest concern seems to be the Delta variant which is now spreading rapidly in the United Kingdom. The Delta variant appears more transmissible than other strains, which pushes up the reproduction number and the vaccination threshold for herd immunity. Combined with signs of vaccination reluctance, this is likely to remain an ongoing concern for policymakers as highlighted by PM Johnson’s decision to delay lifting the remaining Covid-19 restrictions, previously scheduled for June 21st, to July 19th. On a positive note, the available evidence suggests the Delta variant doesn’t seem to materially reduce the efficacy of existing vaccines as long as individuals are fully vaccinated.
The risks to our economic outlook are still largely related to the evolution of the pandemic and the success of the vaccination campaigns. The emergence of new Covid-19 variants is a major downside risk, in particular should the available vaccines prove ineffective or significantly less effective. The potential for vaccination fatigue is also an important downside risk that could delay reaching the herd immunity threshold. In the face of lingering uncertainty, we maintain three scenarios: the baseline (a gradual recovery strengthening from H2 2021 onwards), to which we attach a probability of 70%; the pessimistic (a disrupted and unsteady recovery) with a probability of 20%; and the optimistic (a sharp and strong recovery already in H1 2021) with a 10% probability.
Recovery in the euro area set to gather steam
The euro area economy shrank less than initially reported in the first quarter with the final release of GDP revised slightly upward from -0.6% qoq to -0.3% qoq. Looking at the details, household consumption declined sharply amid adverse virus dynamics and strict lockdowns, while both investment and a change in inventories contributed positively to headline growth. A solid pick-up in exports was also supportive for activity, while strong imports are indicative of growing demand. Overall, the final Q1 GDP data confirmed the resilience of the euro area economy, in large part owing to households and firms having successfully adapted to an environment with mobility restrictions in place (see Box 1: Not all economies are equal against the Covid-19 virus).
Box 1 – Not all economies are equal against the Covid-19 virus
The Covid-19 pandemic affected all economies worldwide. But the economic damage was not the same everywhere, including within the euro area. Figure B1.1 compares the value added in the six largest euro countries in the first quarter of 2021 with that of the fourth quarter of 2019, the last quarter before the pandemic. The figure shows that the economic loss compared to the fourth quarter of 2019 in Spain was still over 9%, significantly higher than in the Netherlands (3.2%) and Belgium (3.4%).
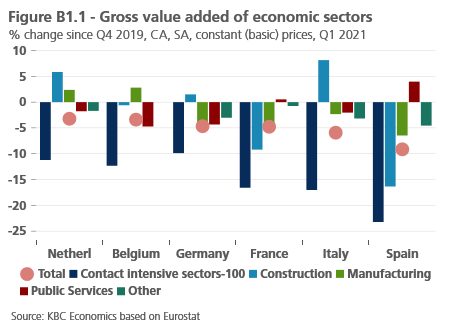
The figure also shows the impact on economic sectors. As expected, contact-intensive sectors, including wholesale and retail trade, transport, hospitality and the arts and leisure sectors, were hardest hit in all countries. However, the impact on these sectors still varied widely from country to country. In Germany, added value in the first quarter of 2021 was ‘only’ 10% lower than just before the pandemic, while in Spain it was more than 23%.
These differences may be related to the severity and duration of contact restriction measures taken to contain the pandemic. But these measures do not fully explain the differences. According to the Oxford University measure, the severity and duration of measures were, on average, lowest in Belgium and the Netherlands over the period February 2020 to March 2021. However, the economic impact on contact-intensive sectors there was somewhat larger than in Germany, where the measures were generally more restrictive. Meanwhile, according to the Oxford indicator, measures in Spain were more restrictive than in the other countries, with the exception of Italy. However, though the contact-intensive sectors in Italy were strongly affected, it was less so than in Spain. So, the nature of contact restrictive measures and the way people deal with them probably also played a role in the economic impact.
Differences in this regard probably also explain part of the varying economic impact on the construction sector. Other factors, such as exceptional weather conditions, which very often influence the course of construction activity, either positively or negatively, may also play a role. The relatively strong performance of construction in Germany and the Netherlands may also be partly due to the spill-over effect of the construction boom that both countries experienced just before the pandemic. In France, on the other hand, construction activity slackened just before the outbreak of the pandemic. This slump was probably accentuated by the Covid-19 crisis, especially since the closure of the French public services during the first lockdown may have delayed the delivery of some building permits.
The global economic impact of the pandemic is determined by its impact on different economic sectors. But the global differences between countries also reflect the relative economic importance of heavily versus less-heavily affected sectors. For example, the sharp decline in the Spanish economy is due to the severe contraction of the construction sector and especially of contact-intensive services, but also to the relatively large economic share of both sectors in the Spanish economy.
Such structural features are also important for understanding the differences in the impact of the Covid-19 pandemic on manufacturing. In general, the industry was particularly hard hit during the first wave of the pandemic in spring 2020. During the subsequent waves, most industrial companies managed much better to reconcile the distancing requirements due to the virus with the continuation of their economic activity. Partly driven by the pick-up in international trade, a recovery in the manufacturing sector started already in the second half of 2020.
If we look at the individual industrial sectors, however, the picture is more nuanced. The recovery of production in the automotive, textile and, to a lesser extent, chemical industries – sectors that were already in recession before the outbreak of the pandemic – has started to falter in the first months of 2021. This is not so much due to the pandemic, but to structural adjustments and, more recently, supply bottlenecks. By contrast, output in investment-led sectors, such as mechanical engineering, metal processing and electrical equipment manufacturing, rose steadily. The strongest performance in the recent past, however, has come from the pharmaceutical industry, among others. This sounds hardly surprising against the background of the efforts to quickly produce a Covid-19 vaccine. But even before the pandemic broke out, the pharmaceutical industry was booming and thus an outlier compared to the recession in the rest of the industrial sector.
These divergent sectoral developments are behind the changes in manufacturing value added shown in Figure B1.1. For example, the relatively low level of value added in Spanish manufacturing is also the result of the relatively large share of recently weak performing industrial sectors in Spanish manufacturing. In contrast, the strong performance of the Belgian and Dutch industries is due to the large share of strong performing sectors, such as chemicals and especially pharmaceuticals, while the weaker sectors in both countries have a relatively small economic weighting. The overall disappointing performance of the German economy in the first quarter of 2021 (see main text) follows from the observation that the industrial recovery there is less advanced than could have been expected on the basis of the resurgence of world trade and buoyant sentiment indicators. This is because the recovery of production in the investment-led manufacturing sectors was partly offset by the sluggishness in the automotive sector, which is of great importance for Germany.
Meanwhile, the first batch of second-quarter hard data came out somewhat mixed. Industrial production in the euro area increased by 0.8% mom in April, while retail sales dropped by 3.1% mom, led by declines in Germany and France, where restrictive measures on non-essential shops were temporarily tightened. Substantial easing steps have, however, taken place since then, which is reflected in the strong May reading of the European Commission consumer confidence survey. As a result, consumer confidence in the euro area now stands above its pre-virus level for the first time (and is the highest since mid-2018), showing encouraging signs for near-term activity.
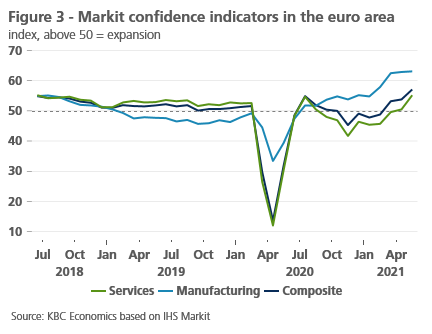
Furthermore, recent business confidence gains add to our optimism about euro area growth in the second quarter. The headline PMI picked up more than expected in May from 53.8 to 57.1, driven by the services sector benefiting from the reopening in most parts of the common bloc (figure 3). On the manufacturing side, the index reached its highest level on record, indicating ongoing cyclical strength of activity. On the flip side, there are signals that widespread supply chain disruptions are starting to hold back output, namely in Germany, where industrial production declined by 1.0% mom in April with the automotive sector being hit particularly hard by the global semiconductor shortage.
We believe that a strong recovery is now gathering steam in the euro area following some sluggishness at the beginning of the current quarter. As a result, we maintain our view that the recovery should take off in the second quarter and gain momentum in the remainder of 2021 as more containment measures are rolled back and pent-up demand is released. In addition, the Next Generation EU recovery fund has finally become operational and should start disbursing funds to member states in the second half of this year (also see KBC Economic Opinion of 8 June). All in all, we now expect the euro area economy to expand by 4.1% in 2021 (marginally up from 3.9% previously due to the revision of historical data), and 4.4% in 2022. All this implies that the euro area as a whole is expected to return to its pre-pandemic level of output by early 2022.
The US economy maintains strong momentum
In contrast to the euro area, the economic recovery in the US is already in full swing as suggested by the final release of GDP data which confirmed a 6.4% annualised growth rate in the first quarter. This is despite retail sales data which saw a month-on-month decline in May following relatively flat monthly growth in April. However, we should note that the latest readings are more likely a correction from the exceptional stimulus check-driven 10.7% mom jump in March rather than any material slowdown. Compared to a year ago, retail sales are still seeing double-digit growth and we expect strong consumption during the remainder of the year, aided by an ongoing reopening of the economy, still strong consumer sentiment and record household savings. Industrial production data also point towards a continued pick-up in recovery, with manufacturing increasing by 0.9% mom, due in large part to a gain in motor vehicle assemblies; excluding car manufacturing, factory output increased by 0.5% mom.
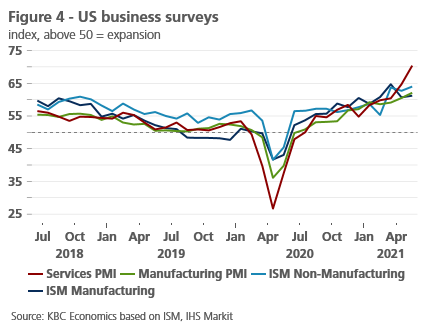
At the same time, recent business confidence indicators point to strong momentum, which is consistent with our view of strengthening real GDP growth in the second quarter. The May PMI composite index came out at a record high of 68.7 with substantial gains across manufacturing (62.1) and services (70.4). Similarly, the ISM services survey hit a new record high, beating expectations amid a rapid reopening of the economy. Meanwhile, the ISM manufacturing index also picked up in May, boosted by new orders and inventories (figure 4). Still, the strengthening of the composite headline masks signs of intensifying supply bottlenecks, which is reflected in the still-lengthening supplier delivery times.
As a result, incoming data paint a picture of an accelerating economy constrained by persistent supply bottlenecks. Along with shortages of semiconductor and some raw materials, more manufacturers report difficulties hiring workers to staff production lines. This suggests that the US labour market is experiencing some notable – possibly temporary – supply and demand imbalances. After a disappointing 278,000 gain in headline employment in April, payrolls rose a moderate 559,000 in May, a touch softer than consensus expectations. More importantly, labour force participation slipped to 61.6%, indicating little sign that the labour market is enticing back workers who had exited during the pandemic. This is likely due to several reasons, including the effect of extended unemployment benefits, school disruptions and ongoing childcare (preventing parents from participating in the labour market), and early retirements among some older workers who lost their jobs and decided to leave the workforce.
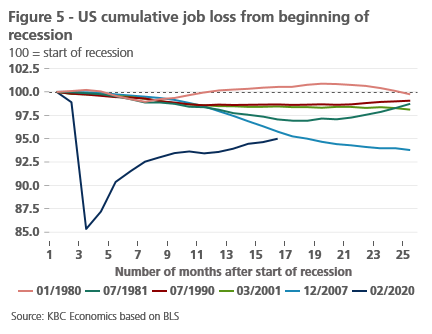
Following May’s increase in employment, the US economy is now two-thirds of the way back to the pre-pandemic employment levels with a shortfall of 7.6 million jobs. The progress since the trough of the pandemic crisis has been impressive, but the lingering shortfall is still large compared to previous recessions, suggesting that the road to a full recovery will take some time (figure 5). The sizable jobs shortfall remains in the spotlight of the Federal Reserve which maintains its emphasis on improvements in the labour market, implying that further material progress toward full employment needs to be achieved before the Fed starts its tapering of the asset purchases programme.
All in all, our assessment of the US economic outlook remains largely unchanged from last month. We expect real GDP growth to accelerate further in the second quarter and remain strong in the latter half of the year, supported by heavy fiscal support and pent-up demand. As a consequence, we keep our growth outlook for both 2021 and 2022 unchanged at 6.5% and 4.0%, respectively. This implies that the US economy is on track to recover to its pre-pandemic level already during the second quarter. Furthermore, we continue to flag upside risks to the GDP outlook due to stronger-than-expected pent-up demand from US consumers and further government spending plans.
Strengthening inflationary pressures
Near-term Inflationary pressures are strengthening considerably across the advanced economies. A key driver of higher inflation thus far in 2021 has been higher energy costs and base effects that have yet to fully run their course. Furthermore, the ‘reopening effect’ on aggregate prices has been significant, particularly in the US and to a lesser extent in the euro area, where the easing of mobility restrictions is delayed. Finally, the emergence of widespread supply-side bottlenecks led to the unprecedented rise in input prices as manufacturers struggle to meet the surge in demand, fuelling inflationary pressures further.
In general, the recent inflation prints have come out somewhat stronger than envisaged, and it may likely take some significant time for these pressures to clearly ease. Nonetheless, we expect price pressures to moderate eventually as the disruptive effects of the pandemic ease further (i.e. once ‘opening up’ is completed), and supply bottlenecks start to dissipate. In other words, we believe that inflation is currently mostly driven by transitory factors which are set to fade away gradually.
Importantly, the primary argument in favour of the transitory nature of current inflationary pressures is the ample spare capacity that has been created. In the euro area, there are some 3.3 million fewer at work than prior to the pandemic, implying a significant employment gap. At the same time, we continue to hold the view that the structural forces weighing on inflation such as globalisation and ageing have not been removed by the pandemic. Still, there remain large uncertainties around the inflation profile going forward, and, while we do not anticipate spiralling inflation, the risks to inflation in the coming quarters and probably beyond are clearly tilted to the upside.
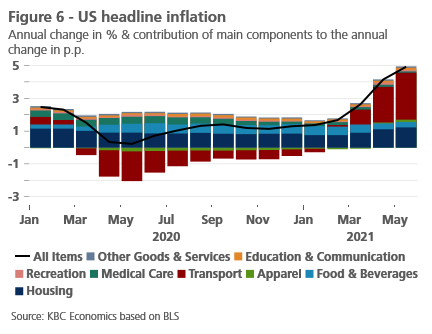
In the US, headline CPI inflation has surprised to the upside again, and surged from 4.2% yoy in April to 5.0% yoy in May, the highest level since 2008. More importantly, core inflation jumped to 3.8% yoy, the fastest rate in nearly three decades (figure 6). As with the earlier CPI readings, much of the firming was driven by a handful of categories that have proven unusually sensitive to reopening pressures, including used cars and airline fares. We think that US headline inflation may be at or close to a peak in May, but should remain firm in the months ahead due to energy base effects, further reopening, as well as persistent supply bottlenecks. The recent upside surprises (and to a lesser extent higher expected oil prices) prompted us to upgrade the US inflation outlook, now expecting annual inflation to pick up to 3.2% (from 2.8% previously) in 2021, before easing somewhat to 2.3% (from 2.1% previously) in 2022.
Meanwhile, headline inflation in the euro area accelerated to 2.0% yoy in May from 1.6% yoy a month ago, mostly on the back of a base effect in energy prices. Core inflation, however, remained relatively muted, edging up by 0.2 pp to 0.9% yoy. Headline inflation in the euro area could rise further through autumn. This will be due to the delayed reopening of the euro area economies, coupled with ongoing supply-side price pressures, as well as the unwinding of the German VAT reduction. Consistent with our slightly upgraded oil price outlook, we have revised our inflation outlook by 0.1 pp upward to 1.8% in 2021. A pullback in headline inflation to 1.4% next year is largely a technical development on more stable oil prices. It also suggests that we do not envisage a sustained surge in price pressures over the medium to longer term.
ECB remains in a wait-and-see mode
As broadly expected, the ECB kept an unchanged monetary policy stance at its June policy meeting. Most importantly, the Governing Council signalled that discussions of any tapering of its asset purchases programmes are premature at this point. As a result, the central bank maintained unchanged the pace of net purchases under the Pandemic Emergency Purchase Programme (PEPP) for the third quarter of 2021 with a view to preserve favourable financing conditions. ECB President Lagarde reiterated that the central bank will continue to take advantage of the flexibility of PEPP but did not offer a specific roadmap for exit from PEPP.
We expect the ECB will start scaling back the pace of monthly PEPP purchases from the beginning of next year and will not extend them beyond March 2022. At the same time, our assumption is that (part of) any remaining PEPP portfolio will be ‘transferred’ to the Asset Purchase Programme (APP) – which is currently open-ended and running at a EUR 20 billion monthly pace – to achieve a more gradual decline in bond purchases. Overall, we hold the view that the ECB is set to conduct very easy monetary policy throughout our forecast horizon, meaning that the potential end date for the net purchases under the APP, as well as the start of the normalisation of policy rates is not expected before 2023.
In the US, the Fed also left its very accommodative policy stance unchanged at its June meeting. However, the central bank adopted a somewhat more hawkish tone, in particular with respect to the updated summary of economic projections. As a result, the median projected path for the policy rate now assumes an earlier and faster normalisation than previously expected with two rate hikes by end-2023. On the inflation front, Fed Chair Powell reiterated that the FOMC sees the rise in inflation as largely reflecting transitory factors, including base effects and those related to the reopening. Similarly, the Fed still believes that the US economy needs to make ‘substantial further progress’ before the central bank begins tapering its asset purchases programme.
On the bond market, sovereign yields have stabilised and even retreated somewhat after the sharp spike earlier in the year, despite a significant firming of inflation. Our outlook for long-term interest rates assumes some room for upward movement over our forecast horizon. We see the 10-year US Treasury bond yield rising to 2.15% by the end of 2021 and further to 2.50% by end-2022. In the euro area, the 10-year Bund yield is projected to leave negative territory in the third quarter of 2021 and reach 0.4% by the end of 2022, on the assumption that the German post-election political landscape – with the Greens becoming a pivotal party – will move towards more expansionary fiscal policy. Against the background of abundant ECB liquidity, we maintain our view that intra-EMU spreads will remain at moderate levels over the forecast horizon, although transitory flare-ups related to election cycles present possible risk factors.
In currency markets, the US dollar has lost ground since early April, weakening above 1.20 EUR/USD. We are now pencilling in a much weaker trajectory for the greenback which is expected to depreciate to the level of 1.26 by the end of 2021 and 1.35 by end-2022. Such a pronounced weakening will be largely a result of widening twin deficits (see Box 2: The US twin deficits: no cause for concern yet) and the related financing requirements. It will be only after 2022 that the US dollar will regain some strength on the back of real rates support and will gradually converge to our estimate of the fundamental fair value around 1.30 EUR/USD
Box 2 – The US Twin Deficits: no cause for concern yet
The US trade balance has deteriorated sharply again recently. Expressed in current dollars it even reached a new historic record. This deficit is caused by a deficit on the goods trade balance, which cannot be compensated by the surplus that the US records on the services balance. As a percentage of GDP, however, the trade deficit looks less worrisome (see Figure B2.1). It is not yet as large as in the period just before the financial crisis and the Great Recession.
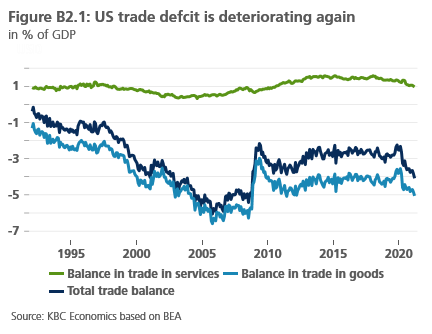
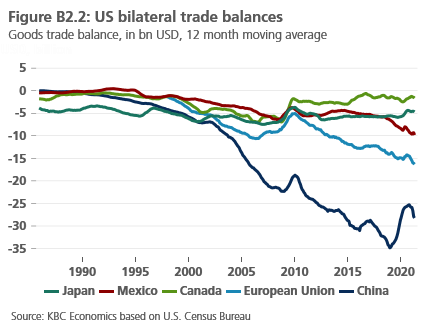
Figure B2.2 shows the regional breakdown of the US trade deficit. Three observations stand out. First, since 2010, the U.S. deficit with Japan, expressed in current dollars, has remained virtually stable and at a moderate level. The deficit with the EU, on the other hand, widened steadily over the same period. However, the deficit with China in particular increased sharply. This trend had already started in 2001, when China joined the World Trade Organisation. Partly as a result of the trade tensions during the Trump administration, the US trade deficit with China temporarily decreased somewhat, but since the beginning of 2021 it has resumed its structurally increasing trend.
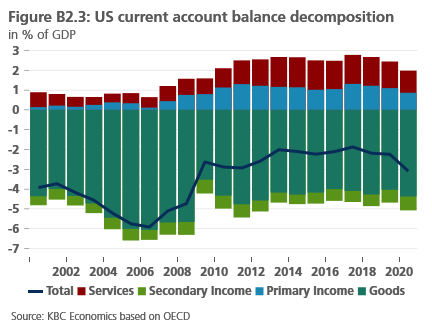
The US trade balance is also the main determinant of the US current account balance. This balance is also deteriorating again. The current account deficit is comprised of deficits in the balance of goods trade and international transfers, which cannot be offset by surpluses in the balance of services trade and primary income flows (Figure B2.3).
What is the main driver behind this rising external deficit? From a macroeconomic perspective, the current account balance primarily reflects the difference between total national savings (income minus consumption) and total national investment by government, households, and businesses. From this perspective, the increase in the external deficit in the US is determined by a rising investment rate, which is also accompanied by a declining savings rate (both in % of GDP). According to the latest IMF forecasts, the US national investment ratio will increase by 0.7 percentage points of GDP in 2021, while the national savings ratio is likely to fall by 0.3 percentage points of GDP over the same period. The result, still according to IMF figures, is an increase in the current account deficit of just under one percentage point of GDP (0.8%).
In turn, the declining savings ratio is to a large extent due to the government’s falling savings rate. The IMF estimates that the total government budget deficit will be as high as 15% of GDP in 2021. This lack of savings will not be fully compensated by the savings of households and businesses. On balance, the rising government deficit and the related current account deficit thus lead to the phenomenon of the so-called Twin Deficits for the US economy.
At this stage, these Twin Deficits are not a cause for concern. In particular, the current account deficit is not yet of the same magnitude as just before the financial crisis. At the time, these external imbalances could be seen as a warning sign of the forthcoming international crisis. Nevertheless, there is reason for caution. The US economy is currently relying on international confidence in the US dollar as a reserve currency, which allows it to finance its external and fiscal deficits smoothly for the time being. The danger lurks in the deficits becoming too large or if they are allowed to persist for too long. In that case, a decline in international confidence could quickly lead to higher rising US interest rates and a weaker dollar than we currently envisage in our scenario for 2021 and 2022.
All historical quotes/prices, statistics and charts are up to date, through June 14, 2021, unless otherwise noted. The positions and forecasts provided are those of 14 June 2021.