
Economic Perspectives September 2023
Read the publication below or click here to open PDF.
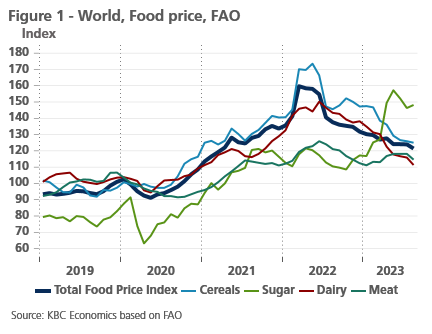
- European gas prices increased by 15% to 32 EUR per MWh, as strikes in Australia threaten an important part of global LNG supply. They remain 86% lower than a year ago, however. Well-filled EU gas reserves keep prices under control and provide some comfort going into the fall. Oil prices rose by 4% in August (and close to 25% in the third quarter) thanks to high US demand and OPEC+ production cuts. Global food prices declined by 2.1% last month, due to successful harvests and lower demand.
- In the euro area, headline inflation was slightly down from 5.3% in July to 5.2% in August, while core inflation declined from 5.5% to 5.3%. While energy prices increased slightly, food price inflation moderated from 10.8% to just below 10% year-on-year. Within core components, the early signs of some relaxation of services inflation is encouraging. However, given the outlook on energy prices, we slightly upgraded our inflation forecasts from 5.6% to 5.7% for 2023 and from 2.9% to 3.1% for 2024.
- US inflation increased from 3.3% to 3.7% as energy prices increased while food inflation moderated. Contrary to headline inflation, core inflation declined further to 4.4%, as goods prices decreased and shelter inflation slowed. Service inflation accelerated, however, due in part to higher transportation service prices. We thus upgrade our inflation forecast from 3.9% to 4.1% in 2023 and from 2.2% to 2.5% in 2024.
- Lower core inflation readings are prompting central banks to pause the rate hiking cycle. The Fed already kept rates stable at the September FOMC meeting and we believe that it will keep rates stable at the November meeting, though we see major upside risk here. The ECB, while hiking its policy rates, flagged that it might pause going forward. We expect rates to remain at the current levels well into 2024, however. Continued quantitative tightening will also allow both central banks to keep draining excess liquidity and tighten monetary conditions.
- The euro area economy is slowing. Growth in Q2 only increased by 0.1% quarter-on-quarter, as consumer demand stagnated and net exports fell. Furthermore, the near term shows little signs of improvement. On the contrary, producer sentiment indicators have deteriorated across all sectors. German manufacturing in particular is going through heavy weather. Our euro area growth projections pencil in a significant slowdown in 2023 (0.5%) and a gradual recovery in 2024 (0.7%)
- In the US, the economy continues to withstand the pressure of monetary tightening. Consumption growth remains elevated, while residential investment is rebounding. The labour market also looks healthy as the labour force increased markedly, thanks to a big inflow of foreign-born labour. Going forward, the dwindling of pandemic-related excess savings, the resumption of student debt payments and continued monetary tightening are likely to weaken growth. We expect the Fed to engineer a soft landing of the US economy, slowing growth from 2.2% in 2023 to 0.9% in 2024. A deep recession due to persistent monetary tightening seems less likely.
- In China, the post-covid recovery remains sluggish, as its real estate troubles keep on spreading, increasingly damaging the wider economy. Retail trade, industrial production, and external trade all disappointed over the summer. Furthermore, high household debt is weighing on consumer sentiment. Currently, the government policy responses remain insufficient to keep growth on target. We downgrade our 2023 growth forecast from 5.1% to 4.9% for 2023 and from 4.5% to 4.1% in 2024.
Major economies on divergent paths
The major global economies are facing different economic realities. In the US, the economy is resisting monetary pressure surprisingly well. Consumption remains remarkably strong and even residential investment is increasing again, unprecedented monetary tightening notwithstanding. Though the exhaustion of post-pandemic savings and the resumption of student debt repayments might bring consumption down in coming quarters, there is increased hope that the US economy will manage to avoid a recession and manage a soft landing.
Contrary to the US, the Chinese economy has underwhelmed and has not experienced a major reopening growth spurt. Due to increasing real estate troubles, too cautious stimulus measures and lower exports, economic growth might barely reach the 5% growth target set by the CCP. Furthermore, low consumption - if worsening - might even push China into a deflationary spiral.
Finally, there is Europe, where economic growth remains sluggish and inflationary pressures, while decreasing, remain high. Sentiment indicators have reached new lows, especially in Germany. The slowdown is a result of the energy crisis, tighter monetary policy and decreasing global demand. Growth is likely to remain sluggish as the ECB will keep rates elevated this year and part of next year.
Gas and oil prices rise
Due to disagreements over pay and working conditions, workers at Chevron’s Gorgon and Wheatstone LNG projects (Australia) went on strike on 8 September. The two projects account for 7% of total global LNG capacity. The strike announcement pushed up European gas prices. They reached 32 EUR per MWh in August, 15% higher than a month ago. Prices remain 86% lower than a year ago, however, as EU gas reserves remain well-filled. They are now 94% full, 12 percentage points higher than usual at this time of the year. Futures markets indicate that prices could rise above 50 EUR per MWh during the next winter season. That said, the sky-high reserves and the low(er) probability of harsh winter conditions (given the arrival of El Nino), make critical gas shortages in Europe unlikely.
Meanwhile, oil prices rose by 4% in August. Prices have been on an upward trend this summer, rising around 25% in Q3, as production cuts pushed OPEC+ supply to two-year lows. Saudi Arabia and Russia extended their supply cuts of 1 million and 300k barrels per day respectively till the end of the year (at least). Nigeria, another OPEC+ member, also produced around 100.000 barrels per day less due to a temporary shutdown of a terminal. Increased supply in Iran, Iraq and Venezuela aren’t enough to offset these declines. On the demand side, higher natural gas prices are driving up demand for oil as oil often acts as a substitute for natural gas. Prices have also been pushed upwards by strong US and Indian demand, and in the background looms the need to eventually refill the Strategic Petroleum Reserves (SPR).
Global food prices declined by 2.1% last month (see figure 1). Despite limited progress on a resumption of the Black Sea grain deal, cereal prices declined by 0.9% as wheat, coarse grains and maize prices went down thanks to a successful harvest. Contrary to other cereals, rice prices, however, increased by 9.8% in the aftermath of India’s rice export ban. Vegetable oil prices, dairy and meat prices all declined due to subdued demand in these categories. Sugar prices went up by 1.3% last month, due to heightened concerns over the impact of El Nino on global supply.
Euro area inflation slightly down
Euro area headline inflation was slightly down from 5.3% in July to 5.2% in August. A larger fall in inflation was prevented by the rise in oil prices. This caused the energy price component to be more than 3% higher in August than in July. Compared to a year ago, this limited the fall in energy prices to 3.3%, down from over 6% in July. Food price inflation decelerated to 9.7%. In contrast to headline inflation; core inflation decelerated further. It fell to 5.3%, erasing the small rise from 5.3% in May to 5.5% in June. Encouraging in this regard are the first signals of some relaxation of services inflation, whose underlying short-term rate of increase, however, is still over 4% year-on-year despite the recent easing. Moreover, services inflation remains the main contributor to headline inflation in the euro area.
We continue to expect headline inflation to fall further in the coming months. The most important driver of the near-term decline in headline inflation remains energy price inflation. That would fall sharply in the next few months as current prices will be compared with the very high prices of last autumn (base effects). However, with the recent rise in oil prices, these base effects will be somewhat smaller than initially expected. As a result, we have slightly raised our forecast for average inflation in 2023 to 5.7% and for 2024 to 3.1%.
US inflation makes a (temporary) jump
US inflation increased from 3.3% to 3.7% in August. Higher energy prices were (again) the prime culprit, as higher gasoline prices drove energy prices up by 5.6% month-on-month. Meanwhile, food price inflation declined from 4.9% to 4.3%. Declining producer prices for food suggest food price inflation might decelerate in the coming months.
Contrary to headline inflation, core inflation declined further from 4.7% to 4.4%. Goods prices declined for the third month in a row, thanks to the continued beneficial effect of easing global supply chains and a stronger dollar. Within goods, used cars and trucks declined by 1.2%, the third decline in a row. Forward-looking indicators point to further declines in the months to come, as the Manheim Used Vehicle Index is down 11% from its peak. Strikes from the United Auto Workers could revert this downward trend, however.
Another encouraging sign from the inflation front is the moderation in shelter inflation, which declined from 0.44% to 0.29% month-on-month. Though this was in part thanks to a sharp decline in hotel prices, owner-equivalent rent inflation also moderated. It might moderate further in the coming months as US rents inflation (as observed by Zillow, a major real-estate company) were essentially flat in the last four months and are now up by only 3.1% year-on-year.
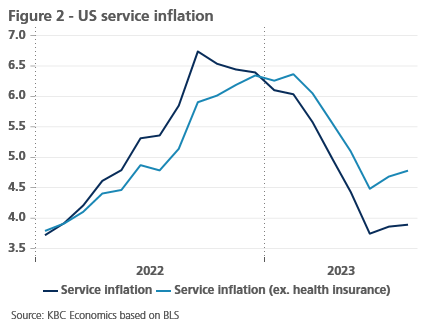
More worrying was the increase in service inflation (ex. shelter and energy services) of 0.5% month-on-month. It remains to be seen whether service inflation will remain at this elevated level. Though average hourly earnings increased by only 0.24% last month, year-on-year wage growth still stands at 4.29%. Furthermore, service inflation has been kept in check by lower health-insurance prices, which declined by 33.6% year-on-year, due to diminishing covid effects (see figure 2). Health-insurance prices are likely to increase again in the coming months. However, the big jump in (volatile) airline prices (+4.9%) might not be repeated in the coming months.
All-in-all, given higher energy prices and service inflation, we upgrade our 2023 forecast from 3.9% to 4.1% in 2023 and from 2.2% to 2.5% in 2024.
ECB and Fed policy rates have likely reached their peak
In line with our projections, the ECB raised all its policy rates by 25 basis points. More specifically, this means that the ECB deposit rate reached 4%, which we expect to be the peak-cycle rate. The start of the eventual ECB rate-cutting cycle is only expected in the second half of 2024. Meanwhile, the ECB will continue its policy of unwinding its Asset Purchase Program (APP) by not reinvesting the maturing assets. This Quantitative Tightening runs in the background and can perfectly well continue when the monetary policy stance will eventually be eased by cuts in the policy rate. Moreover, we expect the ECB to maintain its Pandemic Emergency Purchase Program (PEPP) until well beyond the currently communicated date of end-2024.
As was confirmed by keeping its policy rate unchanged in September, we think the Fed has reached its peak-cycle policy as well. We do not expect that the September rate decision will be a ‘skip’, as we don’t expect another rate hike in Q4 2023, however we see a major upside risk of a final rate hike in November. The future rate path of the Fed is clouded in uncertainty. We expect the Fed to start easing its rate policy stance somewhat earlier than the ECB. Similarly to the ECB’s APP policy, the Fed is expected to continue its balance sheet run-off (QT) at the pace of about 95 bn USD per month (on average 60 bn USD of Treasuries and 35 bn of Mortgage Backed Securities). As is it case for the ECB (APP program), the Fed’s QT is likely to continue after the start of the easing cycle of its policy rates. Risks to the outlook remain tilted to the upside as markets continue to weigh the need for higher-for-longer policy rates.
Against this background, we have lifted the level of the projected bond yield path for the US and Germany. This is partly a so-called reality check of the recent upward bond yield move, particularly reflected in higher real US 10-year bond yields. In turn, these increases in real yields are at least in part driven by a higher market expectation of what the terminal short-term rate beyond 2024 may be. Moreover, a structurally weaker US fiscal position, all else equal, is also likely to contribute to higher bond yields. Therefore, we now expect the US dollar to further consolidate its recent exchange rate gains against the euro in the near term.Only from end 2023 onwards could the US dollar start weakening again, since we consider the US dollar as fundamentally overvalued against the euro.
Intra-EMU sovereign spreads are probably close to their peak, with only limited upward potential. Our three main reasons for this scenario remain valid: the end of the rate tightening cycle by ECB and the nearing of the peak of German bond yields, the existence of a credible ECB backstop in the form of the TPI and the flexibility in PEPP reinvestments. Together with the potential use of the Transmission Protection Instrument (TPI), the flexibility option in PEPP reinvestments has been an efficient tool so far and enjoys a large amount of credibility on financial markets.
Remaining (very limited) upward potential for sovereign spreads stems from the fact that each month euro liquidity is absorbed by the ESCB as a result of the ongoing run-off of ECB’s APP portfolio. In other words, excess liquidity in the system is decreasing. This reduces the ‘search for yield’ pressure exerted by investors on non-benchmark euro-denominated assets and has led in the recent past to a repositioning and a decompression of yield spreads.
Lackluster growth in euro area
In the euro area, the economy continues to look lackluster. The small contraction of real GDP in the last quarter of 2022 (by 0.1% compared to the previous quarter) was followed by hardly any growth in the first half of the year. Quarter-on-quarter growth was 0.1% in both the first and second quarters. By mid-2023, real GDP (after seasonal adjustment) was therefore only 0.14% higher than in the third quarter of 2022, when the ECB raised its policy rate for the first time in this cycle (see figure 3).
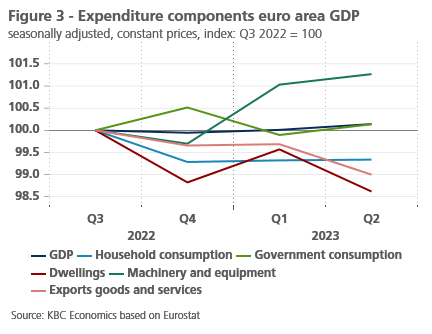
Private consumption was particularly weak. It had fallen by 0.7 per cent in the fourth quarter of 2022 (compared to the previous quarter), and despite cooling inflation, no fast recovery followed in the first half of the year. Growth in the first two quarters was zero per cent each time. Government consumption also barely increased on balance in the past three quarters. Interestingly, despite the sharp rise in interest rates, companies’ machinery and equipment investment still increased by over 1 per cent since the start of monetary tightening. The ECB’s latest lending survey suggests that this may be related to investment needs for the green transition. Business investment dynamics in recent quarters have been in stark contrast to housing construction, which does feel the negative impact of the sharp rise in interest rates. In turn, the affected competitiveness of European industry and the deteriorating international environment are weighing on exports.
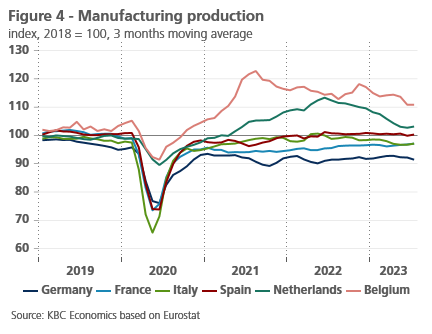
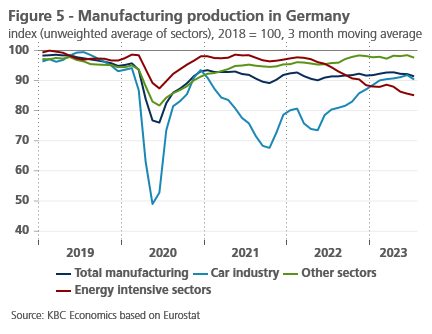
German manufacturing in particular is going through heavy weather. In the three months to July 2023, output was still almost 10% below the average level of 2018 (see figure 4). This is due to the problems in the car industry, which were already underway before the outbreak of the pandemic (see figure 5). The value-added share of the automotive industry in Germany is more than double the eurozone average (5% versus 2.3% in 2018). The problems are therefore having a greater economic impact there, especially as the manufacturing recovery that had been underway - initially by fits and starts - since the end of 2021 seems to have stalled in recent months. Moreover, energy-intensive sectors also have a slightly larger weight in Germany than in the other large(er) eurozone countries. The decline in output, which has been ongoing since spring 2022, is therefore having a slightly bigger impact in Germany.
Judging by the recent development of sentiment indicators in the euron the euro area, little improvement is to be expected for the second half of the year. Both purchasing managers’ confidence indicators (PMI) and European Commission surveys have been predominantly downbeat in recent months. In manufacturing, this trend was already evident since the turn of the year, but the recent figures now also make it clear that the weakness in manufacturing is broadening to the service sectors, while the tightening of monetary policy is also clearly weighing on the interest-rate-sensitive construction sector.
For the eurozone, we expect another three quarters (from Q3 2023 to Q1 2024) of lackluster, below-potential economic growth, at or just above zero growth. For the German economy, we expect another slight contraction in the fourth quarter of 2023. During 2024, further inflation-cooling will allow for a moderate, consumption-led recovery. As a result, real GDP growth in the euro area would rise to 0.7% on average in 2024 after growing 0.5% in 2023.
US economy grows unsustainably
In the US, Q2 GDP was revised downwards from 0.6% quarter-on-quarter to 0.5% quarter-on-quarter. The downward revision was the result of lower inventories and net exports. The Q2 figure remains strong though. Furthermore, incoming hard data for the third quarter are overall constructive. Real personal consumption increased by a healthy 0.6% in July and retail sales suggest consumption will remain high in August. Total industrial production also showed an increase in July (+1%). Even the housing market is bottoming out as housing starts increased by 3.9% in July.
Signals from the labour market also remain relatively bullish. A healthy 187k non-farm payrolls were added in August, though prior months were revised downwards by 110k in total. Average weekly hours also increased by 0.1 hours to 34.4 hours. Furthermore, the civilian labour force increased by a solid 736k, thanks in part to a strong increase in foreign-born workers (+450k in August on a seasonally adjusted basis). This drove up the participation rate by 0.2 percentage points to 62.8%. Unfortunately, many of these new participants had trouble finding a job and hence the unemployment rate increased from 3.5% to 3.8%. Hence the employment-population ratio remained steady at 60.4%. That said, those newly unemployed could find their way to employment in the coming months as there were 8.8 million job openings in July (1.51 job openings per unemployed person). However, some signs of weakening are present too. Job openings were 3.7% lower than in June.. Another weak element in the employment report were the number of people employed part-time which increased by 221k. Temporary help services, typically a leading indicator of future employment, also declined last month.
Forward-looking indicators suggest that current growth figures might be unsustainable. Consumer sentiment indicators edged down in August as higher gasoline prices bite. Business sentiment indicators improved in August but remain low (especially in the manufacturing sector). Meanwhile, factory orders declined by 2.1%. Most concerning is the decline in the personal savings rate, which is well below historic averages (see figure 6). Studies suggest that US consumers have already spent the vast majority of their 2.2 trillion USD in pandemic-related excess savings. Once those excess savings have been exhausted, US consumers are likely to lower their spending levels. Moreover, the resumption of student loan repayments in October will also provide a hit to consumption, as student debt totals 1.8 trillion USD.
Given the current resilience of the US economy, we upgraded our 2023 growth forecast from 1.8% to 2.2%. Nevertheless, we still expect growth to slow to 0.9% in 2024.
Real estate problems hamper China’s post-Covid recovery
China’s economic outlook continues to deteriorate after a slew of discouraging indicators suggest economic activity has been more sluggish than expected in the third quarter. In July, retail sales contracted 0.06% month-over-month while industrial production slowed to only 0.01% month-over-month. Both imports and exports continued to contract in August at 7.3% and 8.8% year-on-year, respectively. Private fixed asset investment contracted -0.5% YTD year-on-year in July, and sentiment indicators, ranging from manufacturing and service sector PMIs to consumer confidence, either remain weak or are trending down. The malaise continues to reflect both the downturn in the real estate sector and weak domestic demand.
The government has introduced a patchwork of policy initiatives to improve investor sentiment and bolster the real estate sector (such as lowering mortgage interest rates and down payment requirements), but large-scale stimulus has so far been missing. With consumer confidence so weak and concerns persisting about real estate developers’ ability to deliver finished projects, Chinese households appear more focused on saving and deleveraging than on taking out new mortgages or spending on consumption. We have therefore downgraded our Q3 GDP outlook from 1.0% quarter-on-quarter to 0.8% quarter-on-quarter and have revised down the outlook for 2023 GDP growth from 5.1% to 4.9%, which is just below the government’s growth target. We have also revised down 2024 GDP growth to 4.1%. There could be an upside surprise in the form of significant stimulus that turns around sentiment in both the household and real estate sectors, but overall, growth risks continue to be tilted to the downside.
All historical quotes/prices, statistics and charts are up-to-date, through September 21, 2023, unless otherwise noted. Positions and forecasts provided are those as of September 21,, 2023.