
Economic Perspectives January 2024
Read the full publication below or click here to open the PDF.
- Missile attacks by Yemeni Houthi’s on carriers in the Red Sea are disrupting global supply chains. They force many ships to avoid crossing the Suez Canal, driving up shipping costs. They also caused upward pressure on oil prices. Oil prices declined markedly in the beginning of December on the back of strong non-OPEC+ supply, but reverted course as the Houthi’s ramped up their attacks. Overall oil prices declined by 4% in December. Natural gas prices also declined in December by 25% to 30.5 EUR per MWh, as warmer and windier weather conditions drove demand down for natural gas.
- In the euro area, inflation increased from 2.4% in November to 2.9% in December. Energy-related base effects were the main driver of the increase. In contrast, food price inflation declined markedly. Core inflation declined from 3.6% to 3.4%, thanks to lower goods inflation. Service inflation remained flat. As the base effects are more favourable in the coming months and given the lower food and goods inflation, we downgrade our 2024 forecast from 2.4% to 2.1% and now expect 1.9% inflation in 2025. As base effects wane, inflation volatility (and uncertainty) is likely to increase going forward.
- In the US, inflation increased from 3.1% to 3.4% in December, while core inflation declined from 4.0% to 3.9%. Within non-core components, there was a big jump in electricity prices, while food prices increased at a soft pace. Within core components, core goods prices remained flat, while there was a solid increase in core services and shelter inflation. We upgrade our inflation forecast for 2024 from 2.5% to 2.8% and expect inflation to be at 2.3% in 2025.
- As inflationary impulses have weakened, central banks have stopped hiking their policy rates. Looking ahead, the Fed’s dot plot suggests three rate cuts this year and policymakers hinted at slowing down quantitative tightening. We expect five rate cuts this year, starting in Q2. The ECB is pushing back against current market calls for early rate cuts and will soon end its full reinvestment policy of the PEPP. Nonetheless, we believe lower inflation prints will convince the ECB to change course and start cutting rates in Q2. We also expect five policy rate cuts in the euro area this year.
- In the euro area, growth is gradually bottoming out. Consumer and producer confidence picked up last month, though they remain at low levels. Especially the manufacturing sector remains in recessionary territory. Within member areas, Germany remains the problem child as both its exports and domestic demand remain weak. The euro area labour market remains resilient and strong, however. We maintain our 0.5% 2024 growth forecast and expect a rebound to 1.3% in 2025.
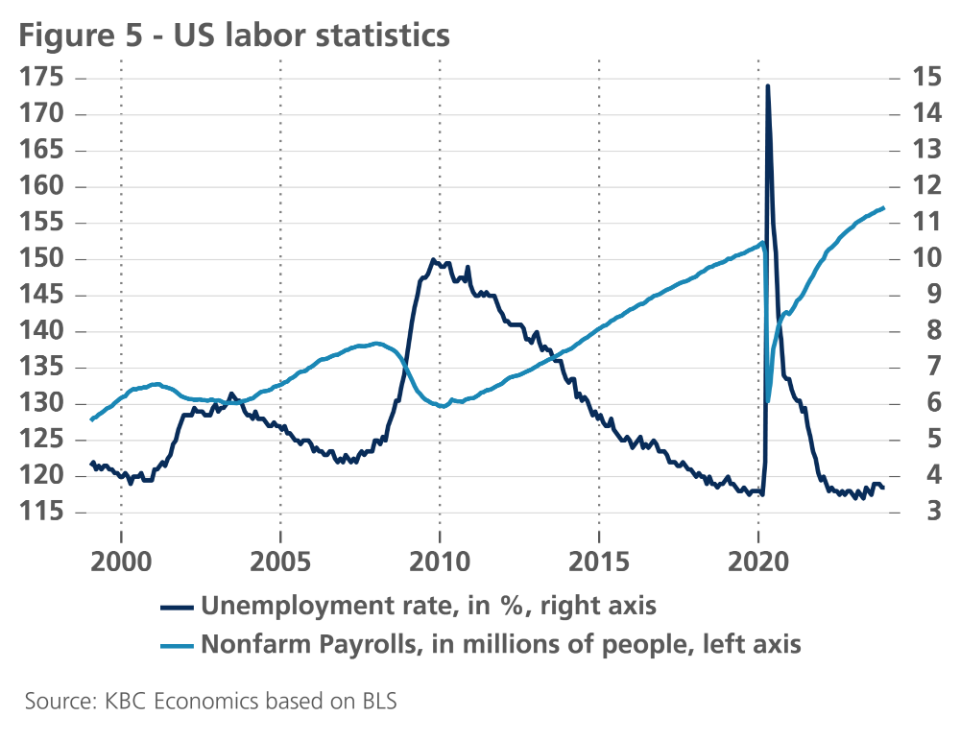
- In the US, the economy is set to slow, but growth is expected to remain positive. Consumer spending remains healthy, while the labour market keeps adding an impressive number of jobs. Nonetheless, signs of weakness are emerging. Job openings are trending lower and producer confidence indicators have deteriorated (especially in services). However, we expect that looser monetary conditions will allow the US economy to maintain 1.2% growth in 2024 and return to a healthier 2% growth in 2025.
- The Chinese economy grew 5.2% year-on-year in Q4 or 1.0% quarter-on-quarter. This brings full year 2023 growth to 5.2%, in line with the government’s growth target of 5%. While tentative signs of improving momentum continue, the data is somewhat mixed, and the Chinese economy faces significant hurdles for the year ahead.
World economy is set to slow in 2024
The world economy is likely to slow markedly in 2024. Tight monetary policy and the Chinese real estate crisis are likely to hold growth below potential, especially in the first half of the year. In the second half of this year, lower inflation will allow central banks to cut their policy rates and support a slow rebound in growth. By 2025, growth rates are expected to return back to potential.
This outlook is subject to major (mostly downward) risks, however. The war in the Middle East could further escalate, causing supply chain disruptions and another energy crisis. China could escalate tensions with Taiwan in the aftermath of the country’s presidential elections, and the US could be headed down a more protectionist and isolationistic course after the November presidential elections.
Global supply chains rattled by Houthi attacks
Yemeni Houthi missile strikes on multiple commercial vessels in the Red Sea have increased the pressure on global supply chains. Approximately 20% of global container volumes pass through the Red Sea. The attacks forced many ships to reroute, lengthening shipping routes and pushing up freight rates (see figure 1). Container flows through the Red Sea were less than half the usual volumes in December and fell below 70% of usual volumes in early January. Asia-to-Europe freight costs have tripled as ships reroute via South Africa. A US-led multinational military operation is striking back, responding with several sea and air attacks on Houthi targets. Yet it could take months before the situation is back under control and shipping volumes through the Suez Canal return to their usual levels. The Suez Canal is not the only major waterway facing lower shipping passages. Since November, lower water levels in the Panama Canal have caused a 30% dip in trade since November.
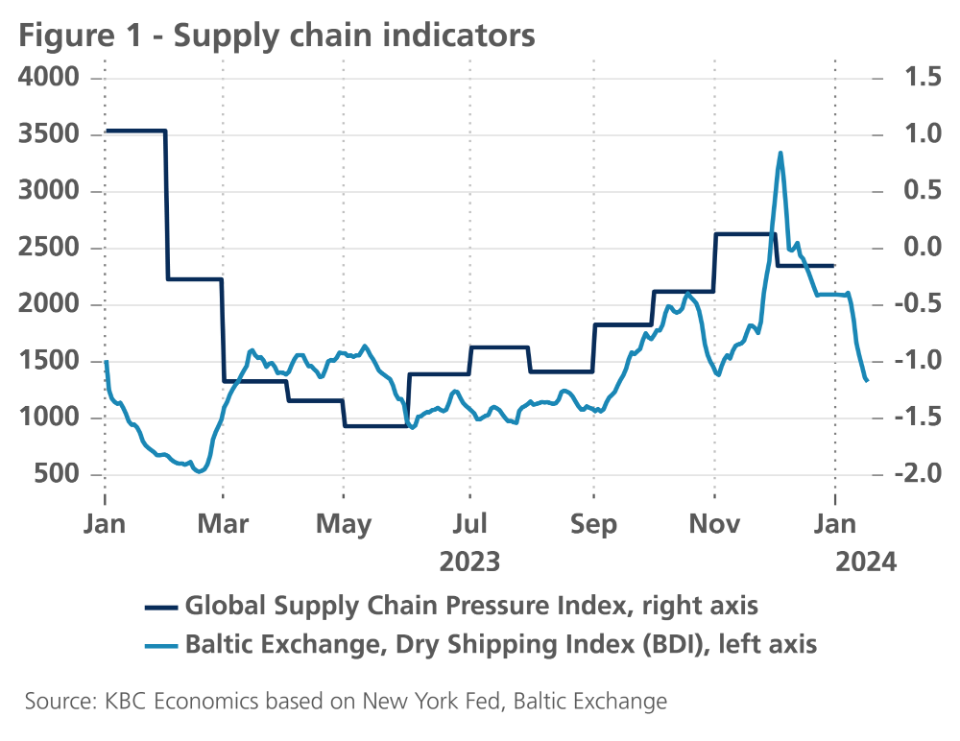
The Houthi attacks also drove up energy prices, as around 10% of seaborne gas and oil pass through the Suez Canal. Oil prices rose from 73 USD per barrel in mid-December to 77 USD end of month, as tensions escalated. However, over the full month, oil prices dropped from 80 USD to 77 USD per barrel, as high non-OPEC+ production volumes (especially in the US) are putting downward pressure on oil prices. All in all, oil prices declined 4% in December.
European natural gas prices declined by 25% in December to 30.5 EUR per MWh, thanks to favourable weather conditions. Strong winds have driven up production of wind energy, reducing the need for gas-powered electricity. Warmer-than-usual weather conditions have also reduced demand for heating. Thanks to this lower consumption, European gas reserves remain well-filled at around 83%.
Global food prices also declined by 1.5% last month, mostly thanks to strong sugar harvests in Brazil. Over the course of 2023, food prices declined by 10%, thanks to large drops in dairy, cereals and vegetable oils prices.
Temporary pause in inflation cooling in the euro area
In the euro area, inflation rose by half a percentage point to 2.9% in December 2023 (see figure 2). The rise was expected, as the downward base effects due to the energy price collapse in autumn 2022 impacted inflation readings. But the increase in inflation was slightly less than expected, as energy price and food price inflation were still slightly lower than initially projected.
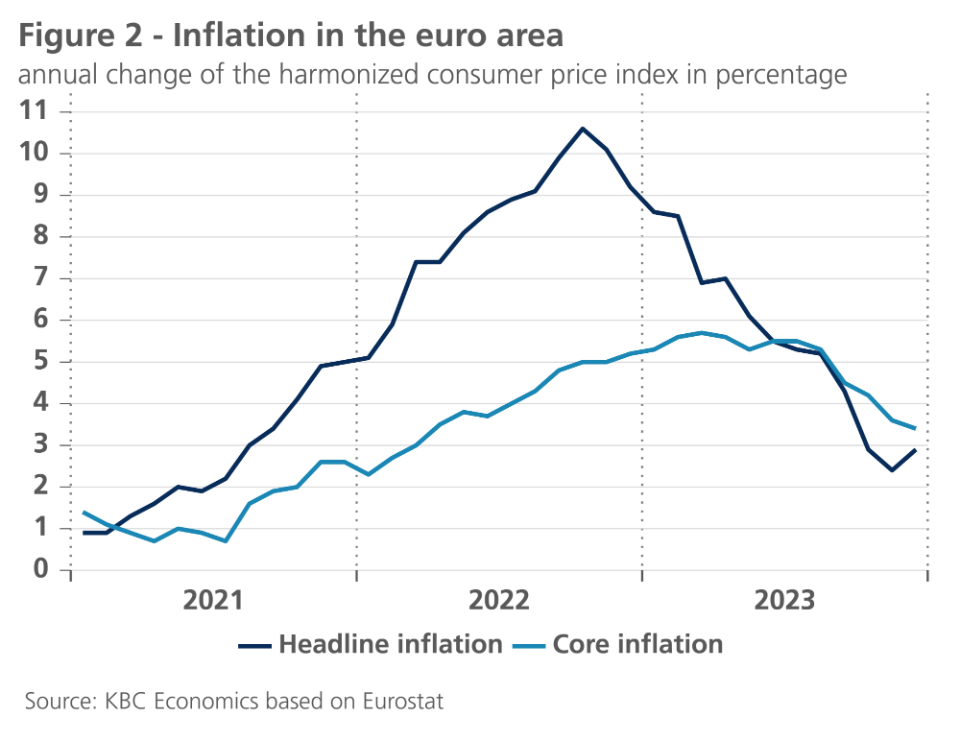
Core inflation did fall further: to 3.4% in December from 3.6% in November. Encouragingly, the recent month-on-month trend in core inflation indicates declining inflationary pressures. It is still too early to declare the definitive end of the high-inflation period. The annual increase in services prices at the end of 2023 was still 3.9%. While this is sharply lower than the June-July 2023 peak of 5.5%, it is still almost double the ECB's medium-term target of 2%. Service inflation in particular is very vulnerable to a wage-price spiral, and wage negotiations are still ongoing for about half of eurozone workers in the first half of 2024. Their outcome could, in theory, complicate or delay further inflation cooling.
However, it is reasonable to assume that at most, those negotiations will achieve wage increases similar to those in recent negotiations, and that part of the resulting wage cost increase will be absorbed, as in the recent past, by a contraction in firms' profit margins. In such a scenario, a further gradual decline in inflation is likely, especially since as economic activity rebounds, labour cost increases could also be absorbed by productivity gains. Moreover, recent inflation dynamics suggest that the cooling of core inflation could be somewhat faster than previously thought. Waning base effects, however, increases the inflation volatility as inflation dynamics become increasingly sensitive to new shocks.
Against this background, we have lowered our forecast for average inflation in 2024 from 2.4% to 2.1%. For 2025, we expect a further cooling to 1.9% on average.
US inflation impulses remain strong in December
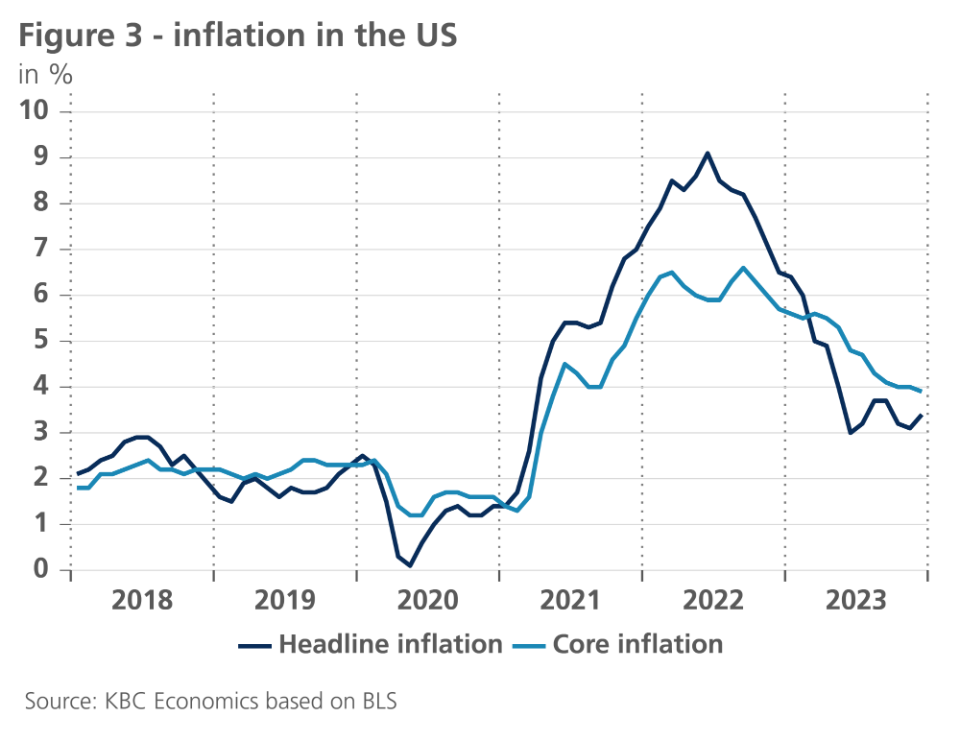
In the US, inflationary impulses remained relatively strong in December, as both headline and core inflation increased by 0.3% month-on-month. On a year-on-year basis, inflation increased from 3.1% to 3.4%, while core inflation declined moderately from 4.0% to 3.9% (see figure 3). Within non-core components, there was a big jump in electricity prices, causing a month-on-month increase of 0.4% in overall energy prices. Food prices increased by a moderate 0.2% month-on-month.
Core goods prices didn’t increase last month (both for the CPI and the PPI). This is despite a 0.5% increase in used car prices. Forward-looking indicators suggest prices might decline in this important component in the coming months.
Shelter prices inflation also continued to increase, by 0.5% month-on-month, and are now 6.2% higher than a year ago. Unfortunately, market rents published by Zillow have accelerated in recent months, increasing 1% last quarter, suggesting it might take more for shelter inflation to moderate.
Services inflation (ex. shelter and energy) also remained too high for comfort, increasing 0.4% month-on-month. Part of the increase was driven by components such as motor vehicle insurance (which follow car prices with a lag) and the volatile airline fares component. Unfortunately, strong increases in average hourly earnings in the last quarter (+1.06%), suggest we could expect some stickiness in services inflation this year.
Given elevated services and shelter inflation and the upside surprise in energy prices, we upgrade our inflation forecast for 2024 from 2.5% to 2.8% and expect inflation to be at 2.3% in 2025.
Euro area economy possibly bottoming out
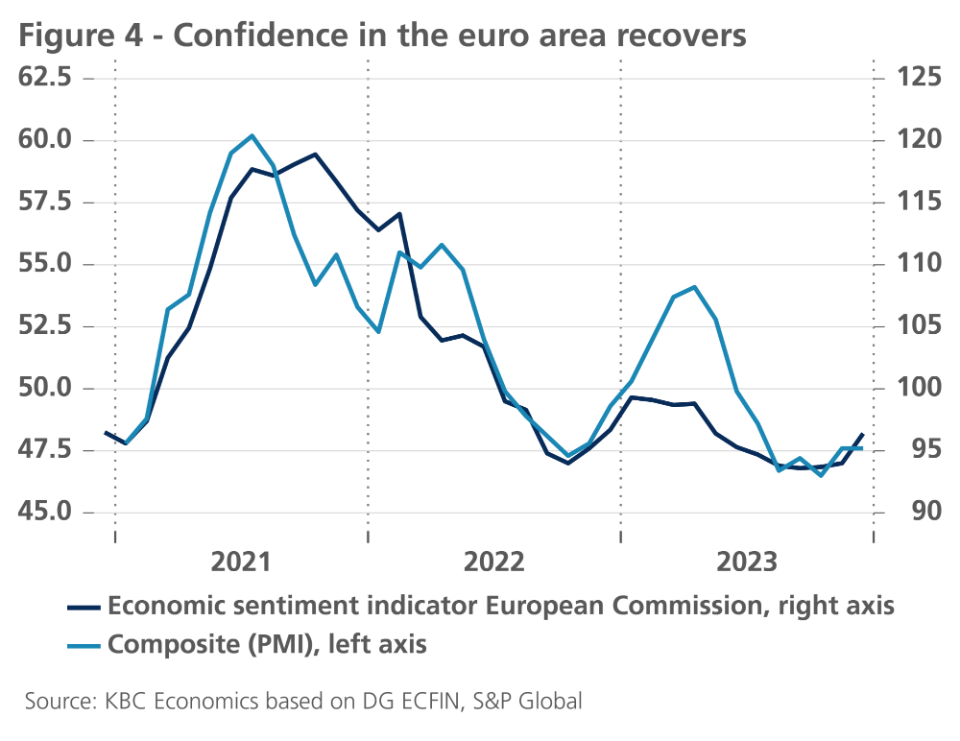
In the euro area, producer and consumer confidence seem to be picking up slightly. This is particularly evident from the European Commission (EC) composite confidence indicator (Economic Sentiment Indicator). It climbed markedly higher in December 2023 after already two previous, albeit relatively timid, increases in October and November (see figure 4). Firms are becoming less pessimistic in almost all sectors, while the loss of consumer confidence that characterised much of 2023 has been reversing during the last two months of 2023. Only in manufacturing is there no improvement, according to the EC indicator. However, the Purchasing Managers' Confidence Index (PMI) shows an improvement in both services and construction and manufacturing. Nevertheless, it should be noted that only for services this indicator scores higher than 50, the threshold marking the distinction between economic expansion and contraction. Similarly, the composite PMI for the euro area only registered 47.6 in November and December, while the EC Economic Sentiment Indicator, despite its recent rise, still remains below its long-term average. While sentiment is clearly improving (from low levels), it is still too early to conclude that the European economy has bottomed out.
The recovery in confidence is thus timid and by no means already points to a strong upcoming economic recovery. In particular, developments in the German economy temper expectations. Indeed, the Ifo institute's confidence indicator displays a less favourable trend than the EC indicator or the PMIs. In particular, expectations for the next six months in the various economic sectors in Germany deteriorated again in December, according to the Ifo indicator, after marginal improvements in the previous months. Clearly, German industry continues to suffer from the lacklustre developments in international trade. But judging by the relatively stronger decline in domestic orders in German manufacturing, the German economy is also weighed down by weak domestic demand. For example, construction output volume in November 2023 had fallen to 4.8% below its year-earlier level. According to the first estimate by the national statistical institute Destatis, the German economy contracted by 0.1% (after adjusting for calendar effects) in 2023.
On the other hand, and somewhat reassuring, the eurozone labour market is holding up relatively well. Employment continues to grow, and the unemployment rate fell slightly back to 6.4% in November 2023. This means that as inflation cools, the higher wages (to be) achieved in most countries and sectors during the recent and still planned wage negotiations (will) inject additional purchasing power into the economy. Some of this is likely to be offset by measures to reduce public budget deficits. But these consolidation measures are not expected to prevent a gradual firming of household spending during 2024. Meanwhile, the flow of credit to the private sectors has also picked up a bit. This is in line with earlier indications that while investment demand is slowing, it remains resilient.
We therefore maintain our growth scenario for the euro area: after a period of quasi-zero growth during the winter months, economic growth will strengthen in the second and third quarters of 2024 and maintain a moderate path thereafter. As a result, real GDP growth would be limited to 0.5% on average in 2024 - the same as the expected growth rate for 2023 - and rise to 1.3% in 2025.
US economy: down but not out
The US economy likely slowed significantly in Q4 2023 (from its elevated 1.3% growth in Q3), mostly due to negative net exports and inventory growth. In contrast, construction spending grew healthily in November, as did consumption. Real personal consumption expenditures grew by 0.3% in November, the low savings rates notwithstanding.
The healthiest part of the US economy remains its labour market. Non-farm payrolls increased by 216,000 in December, while the unemployment rate remained unchanged at a low 3.7% (see figure 5). Signs of softening are also apparent in the labour market, however. Average weekly hours declined from 34.4 to 34.3 hours. The participation rate also declined from 62.8% to 62.5%. Job openings are also on the decline.
Forward-looking indicators also paint a picture of an economy that is slowing but is not turning into a recession. Consumer confidence indicators ticked up nicely in December but remain at relatively low levels. In contrast, producer confidence indicators were mostly down. In particular, the very important ISM Services Index ticked down 2.1 points to 50.6, suggesting low service sector growth in 2024.
All-in-all, we expect that continued fiscal support along with somewhat less tight monetary policies will allow the US economy to maintain 1.2% growth in 2024 and to recover and attain 2% growth in 2025.
China’s economic indicators are mixed
China’s economic outlook remains somewhat muddled. The economy ended the year recording relatively decent growth of 5.2% year-on-year in Q4 while high frequency data sends mixed signals on momentum going forward. The Q4 GDP figure brings full year 2023 growth to 5.2%, which is just above the government’s growth target of 5%. The Q4 figure also leads us to revise up our 2024 growth figure to 4.3% based on overhang effects. There are some other bright spots for China’s outlook. Industrial production increased 0.87% month-on-month in November, its strongest outturn since June 2022, and 0.52% month-on-month in December. A sharp uptick in the December S&P services PMI, from 51.5 to 52.9, is also a welcome signal on sentiment. However, at the same time, consumer confidence drifted down again in November, and investment in the real estate sector contracted 9.6% over the year 2023. This highlights that major challenges still weigh on the Chinese economy, particularly stemming from the ongoing fallout from the real estate sector crisis. While more fiscal stimulus is needed, and is likely, in order to boost confidence and economic growth going forward, policy space (on both the fiscal and monetary front) is limited given growing pressure on Chinese banks (as lower interest rates have squeezed net interest margins and demand for credit remains weak) and growing worries about the fiscal position of local governments. This sets the economy up for a challenging year ahead.
Policy interest rates at peak level
The moderate growth environment in the first half of 2024 in the US and in Europe goes hand in hand with weakening inflationary pressures, especially in the euro area. As a result, we confirm our expectation that 2024 will be a tipping year for Fed and ECB policy. This applies to both interest rate policy and quantitative policy.
Both the ECB and the Fed are expected to implement their first 25 basis point interest rate cut in June 2024. That will kick off an easing cycle in steps of 25 basis points at each of the remaining policy meetings in 2024. This will result in a cumulative 125 basis point rate cut for both central banks. Consequently, by the end of 2024, we expect a Fed funds rate of 4.125% and an ECB deposit rate of 2.75%. The easing cycle will continue into 2025, resulting in both central banks reaching their estimated neutral policy rates of 2.875% and 2.50%, respectively, by the end of 2025. We also expect this to be the bottom of the easing cycle.
This interest rate scenario is broadly in line with market expectations. One salient difference is, however, that the market currently expects the start of interest rate cuts to be earlier and expects cumulative cuts in 2024 to be somewhat more pronounced. On the other hand, the market expects the bottom of the easing cycle to be in line with our expectations.
Gradual decline in inversion of yield curves
Last month, 10-year government yields experienced another bout of volatility. This volatility was higher than can be explained solely by changing expectations on future policy rates. Consequently, both the sharp decline at the end of 2023, and the slight upward correction in early January, were mainly due to the change in the term premium. We still believe that the current level of 10-year interest rates of around 4% for the US, and certainly the 2.2% for Germany, are low, and consequently, a slight upward correction in interest rates may occur during the first quarter of 2024. Over the rest of 2024, the US 10-year bond yield will fall slightly until it returns to its current level. Meanwhile, German interest rates will record roughly stable rates in the neighbourhood of 2.30% in 2024. Indeed, we believe that the current level of German interest rates is unsustainably low based on fundamental factors. For example, the US 10-year real interest rate (measured on the basis of inflation swaps) is broadly positive at around 1.5%, while German real Bund interest rates have again fallen to zero. Sooner or later, there will have to be an upward normalisation, which we expect partially during 2025.
The expected combination of falling policy rates and near constant long-term interest rates will mean that the current sharply inverted yield curve in the US will likely flatten completely around the end of 2024 and steepen during 2025. Because of the larger inversion, the flattening in the euro area will not be complete until later (by the end of 2025).
Against this backdrop, we confirm our scenario for the exchange rate of the US dollar against the euro. Our expectation of a trend depreciation of the dollar is mainly based on the fundamental overvaluation of the currency.
Diverging quantitative policy
In addition to the reversal of the interest rate cycle, 2024 will also be the year of new developments for quantitative policy. At its December 2023 policy meeting, the Fed began its deliberations on the timing and speed at which the ongoing rundown of its balance sheet (QT) would begin to slow. Currently, the Fed is reducing its portfolio of government bonds and mortgage-backed securities (MBS) at an average rate of 95 USD billion per month (60 billion of government bonds and 35 billion of MBS). At the very least, a slowdown of this rate of deleveraging during 2024 is very likely, since the Fed has indicated that it wants to leave ample liquidity in the market.
The ECB's quantitative policy cycle lags behind that of the Fed. The ECB is still in the deleveraging phase of its policy portfolio, and it plans to pick up that pace in 2024. Currently, the ECB is winding down its Asset Purchase Program (APP) portfolio by not reinvesting assets at maturity. Moreover, at its December policy meeting, the ECB announced that it will also not fully reinvest its PEPP portfolio starting in the second half of 2024, with the intention of shrinking the total volume of the PEPP-portfolio by an average of EUR 7.5 billion per month. From the beginning of 2025, the ECB will no longer reinvest at all, leading to an average portfolio deleveraging of EUR 15 billion at that time. That rate of deleveraging is modest compared to the total size of the PEPP portfolio of about EUR 1,700 billion.
For both the Fed and the ECB, the management of its quantitative policy portfolios is related to the amount of excess liquidity that both central banks ultimately want to leave in the financial system as the financial economy approaches a new equilibrium. In our view, a so-called supply-driven floor system of policy interest rates is the most likely choice. That is the system currently used, with, for example, the deposit rate as the ECB's policy rate. Right now, the ECB is considering options for its future operating policy framework. We expect it to announce its conclusions by the end of the first quarter of 2024.
Intra-EMU spreads remain under control
Recent trends in intra-EMU interest rate spreads with Germany remain moderate. We confirm our expectation for medium-term spread levels, despite the fact that most spreads have declined slightly recently. A plausible reason for this relaxed attitude of European bond markets is the end of the ECB policy rate hike cycle, which is causing the ample liquidity in the market to increasingly seek extra-yield in spread markets again. In addition, the ECB's Transmission Protection Instrument (TPI) enjoys a high degree of credibility to counter, if necessary, unwanted spread widening in the European government bond market.
Nevertheless, we expect spreads to gradually rise somewhat from their current levels to their expected equilibrium value during 2024. The declining liquidity provision by the ECB plays a role in this by running down its APP and PEPP portfolio. Despite the limited pace of running down the PEPP portfolio, this does mean that an important "marginal" (re-)investor of government bonds (the ECB) is withdrawing from the market. After all, it is the marginal transaction that determines the bond price and thus the interest rate level. There are also a lot of political risks and elections with uncertain outcomes in 2024. Finally, 2024 is also the run-up to the implementation of the new European budget rules, which are likely to be stricter than we initially expected. We expect this to increase the interest rate spread for European sovereigns with weaker fiscal fundamentals to a limited extent.
All historical quotes/prices, statistics and charts are up-to-date, through January 15, 2024, unless otherwise noted. Positions and forecasts provided are those as of Jan. 15, 2024.