
Economic Perspectives February 2021

Read the publication here or click here to open the PDF
- The major economies have shown signs of stronger-than-expected resilience in the final quarter of 2020, reinforcing our economic outlook for a gradual recovery in the course of 2021. The short-term outlook nonetheless remains challenging amid the rapid spread of new Covid-19 strains, which highlights lingering downside risks. While the arrival of vaccines sets the stage for a turnaround in the pandemic and a strengthening economic recovery later in the year, there are stark differences in the pace of the vaccination campaigns between countries. This suggests a somewhat less synchronised recovery across the world economy in the quarters ahead.
- The euro area economy shrank significantly less than expected in the fourth quarter, bringing the annual real GDP growth rate to -6.8% in 2020. Despite signs of resilience, tight restrictions and a slow vaccination rollout will extend subdued economic activity well into Q1 2021. Significant momentum should build later in the year, backed by a gradual easing of restrictions, strong policy support and an improving external backdrop. We have upgraded the euro area growth outlook from 3.1% to 3.8% in 2021 on a larger positive statistical overhang. Annual growth should pick up further to 4.1% in 2022, pushing euro area output back to the pre-pandemic level.
- The US economy contracted by 3.5% in 2020, reflecting remarkable economic resilience to the pandemic. January data suggest upbeat business sentiment across sectors despite some emerging supply constraints in manufacturing. On the whole, we have become more optimistic about the US economic outlook due to the accelerating vaccination rollout and substantial additional fiscal support. As a result, the real GDP forecast has been revised upward from 4.4% to 5.2% in 2021, implying US output will reach its pre-pandemic level this year. We now also pencil in real GDP growth of 3.5% in 2022, up from 2.5% earlier.
- China’s economic recovery continues at a still swift pace with fourth-quarter real GDP growing faster than expected. This brings annual average growth in 2020 to 2.3%, which is a strong outperformance compared to most major economies. After the early stages of investment-led recovery, the fourth-quarter recovery in consumption is a positive signal for the momentum of the Chinese recovery going into 2021. We therefore maintain our GDP growth outlook of 8.5% in 2021 and 5.2% in 2022.
- Inflationary pressures strengthened in early 2020 on both sides of the Atlantic. In the euro area, January headline inflation spiked due to a number of technical and mostly one-off factors. While we have increased our inflation outlook to 1.3% in 2021, largely on expectations of higher oil prices, underlying price pressures are set to remain reasonably muted over the longer term. Similarly, US inflation is set to rise faster than previously envisaged this year, backed by rising energy prices and upward pressures from fiscal stimulus. Hence, we see US headline inflation picking up to 2.4% in 2021 and 2.2% in 2022.
Global economic activity has shown signs of resilience in the face of surging Covid-19 cases, highlighted by somewhat better-than-expected GDP data for the last quarter of 2020. Across major economies, underlying growth dynamics vary greatly, as is the case with the final 2020 annual growth rates. In the euro area, one of the hardest-hit regions, real GDP shrank by 6.8%, while the US economy contracted by a less severe 3.5%. China was the only major economy to record positive annual growth in 2020, with GDP increasing 2.3%. As a result, pandemic-induced output losses were less pronounced than initially feared, though still significantly larger than during the Global Financial Crisis in 2009.
Increased resilience amid a worrisome virus spread
The fact that major economies have weathered the second wave of the pandemic with a lesser economic impact is not surprising. In the past, we argued that due to the more targeted lockdowns, the absence of large supply disruptions in industry and ongoing policy support, the negative impact on activity would be significantly more limited compared to spring 2020. The economic cost of renewed restrictions nonetheless appears to have declined even more than earlier envisaged. We believe that the increased resilience is for the most part because of the greater adaptability of households and firms, implying that economic activity has become less sensitive to renewed restrictions. In this sense, economic activity has adjusted in ways that signal economies are ‘learning to live’ with Covid-19.
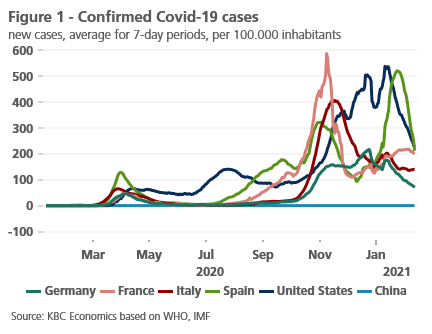
In spite of increased economic resilience, adverse virus dynamics continue to weigh on activity at the beginning of 2021, underscoring the challenging winter months ahead. The rapid spread of more contagious British and South-African Covid-19 strains poses a major concern for policymakers, despite the recent declines in infection rates across Europe and the US (figure 1). China has seen new local outbreaks too, although the spread appears contained for the time being. Globally, containment measures are converging back towards the peak levels seen in April 2020 in order to contain the spread of new virus variants. This is particularly the case for many European countries, where nation-wide lockdowns have been extended and tightened.
Uneven developments of vaccination campaigns
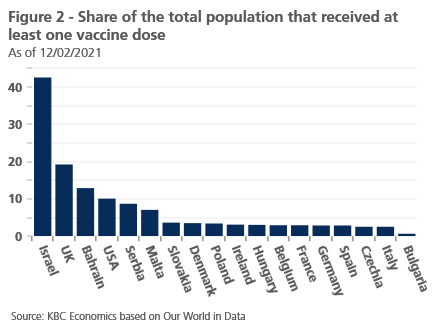
While the evolution of Covid-19 infections dominates the near-term growth outlook, the arrival of vaccines promises a turnaround in the pandemic later in the year. The progress in vaccination campaigns, however, remains highly uneven, signalling a somewhat bumpier pathway out of the pandemic. Israel remains the standout performer in the vaccination race, so far having inoculated more than 40% of the population (figure 2). The UK and the US have also stepped up the vaccination effort recently, with the latter well on track for 100 million doses administered in first 100 days of the Biden administration. In contrast, the European Union’s vaccination rollout is visibly falling behind, which appears to reflect a combination of factors including a shortfall of supplies, heavy bureaucracy and logistics problems. Still, with increased supply in the coming weeks, the vaccine rollouts should accelerate, targeting the most vulnerable groups.
Against this backdrop, we maintain our economic scenario for a gradual recovery in 2021. While still assuming a synchronised rebound in the global economy, a different pace of vaccination suggests a somewhat more nuanced and geographically uneven recovery. In this respect, the US economy appears ahead of the curve, all the more so after factoring in additional fiscal stimulus. In the euro area, new virus strains and vaccination delays set the stage for a somewhat slower recovery that gains traction in the latter part of 2021. Outside the advanced economies, China is projected to rebound strongly in 2021 with positive regional spillovers to other emerging markets. Altogether, we expect all major economies to recover to pre-crisis levels before the end of next year. The poorest economies, on the other hand, will likely experience a delayed recovery, largely as a result of constrained vaccine supply.
Our economic outlook remains subject to considerable risks. Among others, the rapid spread of new Covid-19 variants remains a major downside risk, not least should the available vaccines prove ineffective or significantly less effective. A slow pace of vaccination and related concerns are important downside risks too, potentially pushing back the economic recovery. In the face of lingering uncertainty, we maintain three scenarios: the baseline (a gradual recovery strengthening from H2 2021 onwards), to which we attach a probability of 60%; the pessimistic (a disrupted and unsteady recovery) with a probability of 30%; and the optimistic (a sharp and strong recovery already in H1 2021) with a 10% probability.
A less-than-expected contraction in the euro area
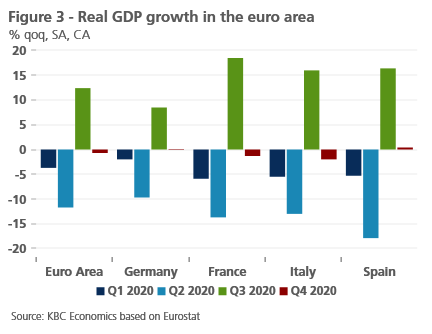
The euro area economy shrank by 0.7% qoq in the final quarter of 2020, significantly less than expected in the face of the second pandemic wave and renewed lockdowns. For the full year, real GDP contracted by 6.8%, which nonetheless masks large differences in the economic performance across the common bloc. The southern economies were generally more exposed to the pandemic shock due to the less favourable structural characteristics (e.g. a high share of tourism), leaving the likes of Spain (-11.0%), Italy (-8.9%) and France (-8.3%) hit hardest. Meanwhile, the northern, industry-oriented economies, led by Germany (-5.3%), showed more resilience throughout 2020.
At the member states level, notable heterogeneity persisted in the fourth quarter, both in terms of underlying growth dynamics and the drivers of that growth. Against expectations, Spain recorded a positive 0.4% qoq expansion, supported by strong household consumption offsetting a drag from investment and net exports. Real GDP growth surprised to the upside in the sense that weakness was less severe than feared in France and Italy, with GDP falling by 1.3% and 2.0% qoq, respectively. In France, both net exports and investment underpinned activity, a similar pattern to that seen in Germany where growth inched up by 0.1% qoq in the last quarter of 2020 (figure 3).
Weak economic activity is expected to extend well into Q1 2021, owing to ongoing tight restrictions and slow initial vaccine rollout. The available high frequency data point to subdued activity in January, highlighted by a drop in the euro area composite PMI to 47.5 from 49.1 in December. Services remain a major drag on business activity, while manufacturing suggests continued expansion. The manufacturing resilience could nonetheless be tested in the coming months with some emerging signs of bottlenecks in global supply chains. Furthermore, negative spillovers from strict lockdowns in Europe are likely to take some toll on industry as suggested by the first decline in German industrial orders after seven consecutive monthly increases in December.
Looking beyond this near-term sluggishness, the growth outlook is more upbeat. We expect a sustained recovery to begin from the second quarter onwards when the progress on the vaccination front should allow for a gradual easing of restrictions. Significant momentum should build later in the year, driven by pent-up demand and a loose policy mix including favourable financing conditions and extended fiscal support. The EU Recovery fund is set to bolster recovery too, though concerns are growing about its implementation, not least in Italy due to the ongoing domestic political turmoil (also see KBC Economic Opinion of 1 February). Finally, the external demand channel will be an important driver of the recovery, backed by a synchronised global rebound.
We have improved our euro area growth outlook from 3.1% to 3.8% in 2021, largely on the knock-on effect of better-than-expected real GDP growth in Q4 2020. In the euro area, the positive ‘overhang’ into 2021 is a sizable 2.1 percentage points, though notable cross-country differences exist (see Box 1). Annual average growth is projected to pick up to 4.1% in 2022. Importantly, the updated real GDP path is consistent with an even earlier recovery to the pre-pandemic level, now assumed in mid-2022.
Box 1 - Pandemic also 'infects' economic growth rates
Economic growth is usually expressed as the change in gross domestic product (GDP) over a certain period of time. Often this is a year. The annual change in GDP then reflects the increase or decrease compared to the previous year, usually expressed as a percentage. But to measure the real pulse of the economy, a year is a rather long period. To get a quick idea of the fluctuations, we also look at the quarterly changes. Economic growth can accelerate or decelerate throughout the year, or even suddenly change dramatically. This was very clearly the case in 2020 due to the covid-19 pandemic. Sometimes these different views give a blurred picture.
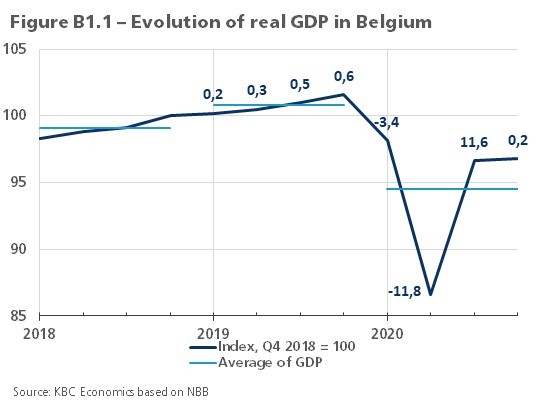
The dark blue line in Figure B1.1 shows the course of Belgian GDP1 from 2018 to 2020, expressed as an index, with the value in the fourth quarter of 2018 as 100. The figure shows that quarter-on-quarter GDP growth in 2019 accelerated from 0.2% in the first quarter to 0.6% in the fourth quarter. The average quarterly growth rate was 0.4% and in the fourth quarter of 2019 GDP was 1.6% higher than a year earlier. Yet in the tables with average growth figures, a growth figure of 1.7% appears for the Belgian economy in 2019. That figure refers to the percentage difference between the average level of GDP in 2018 and 2019. In the figure, this is represented by the light blue lines for each year. Thus, the light blue line in 2019 was 1.7% higher than in 2018.
If growth does not fluctuate too much, these different measurements of growth do not deviate too much from each other. Changes in the annual growth rates then provide a reasonably good and, above all, simple picture of economic development. But with large fluctuations in growth from quarter to quarter, the differences can become much greater. That was the case in 2020 due to the pandemic, as shown by the dark blue line in the figure.
A contraction of 3.4% in the first quarter was followed by a further, much sharper fall of 11.8% in the second quarter. This was followed in the third quarter by a strong recovery of 11.6%, after which the economy grew slightly by 0.2% in the fourth quarter. In the end, Belgian GDP at the end of 2020 was 4.8% lower than at the end of 2019 and the average contraction per quarter was 1.2%. But the total damage to the Belgian economy, as represented by the light blue lines, amounted to 6.2% in 2020. That figure appears in the tables as average annual growth.
By causing large swings in the economy, the pandemic further 'infects' the information value of the usual growth measures. The figure illustrates that the difference between the GDP level in the fourth quarter of 2020 and the average GDP level in 2020 is much larger than in previous years. That difference is called the statistical spillover effect or 'overhang'. It determines how much growth of the past year is already acquired for the average growth rate of the next year. Indeed, if the dark blue line in the graph maintains the level of the fourth quarter of 2020 in the four quarters of 2021, the light blue line of 2021 will be 2.4% higher than in 2020. Thus, without any quarter-on-quarter economic growth in 2021, annual GDP growth would already be 2.4%. Since we expect a gradual further recovery of the Belgian economy, we have set the average growth rate at 4.1% (see main text on Belgium). However, this figure gives the impression of a much stronger recovery than we actually expect. Indeed, more than half of it consists of already acquired ‘overhang’. In normal circumstances, the overhang does not change that much from one year to the next (see figure BE.1) and does not distort the picture painted by the annual growth figures.
Of course, the 'overhang' is not typically Belgian. Its extent differs from country to country, depending on the profile of economic fluctuations. Among the main euro area countries for which GDP figures have been published for the fourth quarter of 2020, Belgium, together with Spain and Italy, occupies a middle position between Germany, where the overhang from 2020 to 2021 is 'only' 1.5%, and France, with an overhang of 3.6%. The 'infection' of the growth figures therefore also clouds the international comparison of growth figures. For the eurozone, the overhang is 2.1%. This is significantly higher than last month's forecast of 0.7%. The difference is explained by the fact that the GDP contraction in the eurozone in the fourth quarter was significantly smaller than expected (-0.7% yoy instead of -2.5% yoy).
The remarkable resilience of the US economy
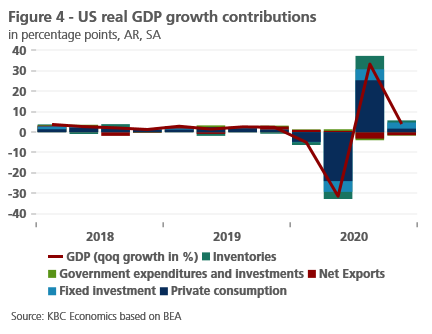
In line with our expectation, US real GDP rose at a 4.0% annualised rate in the fourth quarter of 2020. The expansion was driven by fixed investment, both residential and non-residential. Private consumption also contributed positively to growth, yet its dynamics moderated sharply on the back of a worsening health situation and delays in rolling over fiscal support. In contrast, net exports as well as government spending were a drag on growth (figure 4). Altogether, the US economy contracted 3.5% for the full year 2020, showing a remarkable resilience to the pandemic, with output now only 2.5% below its pre-pandemic level.
The early signs suggest that the US economy started the new year in decent shape. Business sentiment remains upbeat with January ISM data flagging solid activity in manufacturing (58.7) and services (58.7), the latter likely reflecting December’s pandemic relief bill. Similarly, the composite PMI index surged to the highest level since 2015 on the back of broad-based gains in business activity. At the same time, some soft indicators in manufacturing now point to intensifying pandemic-related supply pressures, including rising transportation costs, slowing delivery times and staffing challenges.
Other than sentiment data, there are two important reasons why we have become more optimistic about the US economic outlook. The first is a steadily improving vaccination rollout, reaching now more than 1.3 million a day. The government’s target is to have 300 million fully vaccinated by end-summer. This will allow for a quicker normalisation to pre-pandemic everyday life and economic activity, which will boost spending amid a large savings buffer. The second reason is additional fiscal stimulus, with negotiations currently underway on the final size of the package (also see KBC Economic Opinion of 4 February).
A compromise deal between the Democrats’ USD 1.9 trillion package and the USD 600 billion proposed by Republicans emerging in the coming weeks seems most likely at the moment, adding further to underlying growth momentum. However, with the Senate moving forward with the budget reconciliation process, it is possible that the package will be on the larger end as the Democrats will only need a simple majority to pass the bill.
In circumstances where some concerns are emerging that US fiscal policy might potentially threaten to overheat the US economy, it is worth noting that many elements of the package now being considered represent measures to provide financial support for the unemployed or local and State governments that occur automatically in most European countries. In that respect, these stabilising influences probably should not be thought of as a pure ‘stimulus’ although other elements of the package such as the ‘economic impact payments’ of USD 1,400 to lower and middle income households undoubtedly are. In circumstances where the US economy looks set for a solid rebound, debate about overheating and/or inflation risks may become more commonplace in the months ahead.
We have upgraded the US growth outlook from 4.4% to 5.2% in 2021, implying that the output should recover to the pre-pandemic level in the middle of this year. In 2022, we pencil in real GDP growth of 3.5%, up from 2.5% earlier. At the same time, our GDP outlook is subject to upside risks due to the probability of substantial fiscal support measures and possibly bigger-than-expected pent-up demand from US consumers. The fast-tracking of additional government spending plans, e.g. green infrastructure, is then an important upside risk for the growth outlook in 2022.
China’s strong outperformance
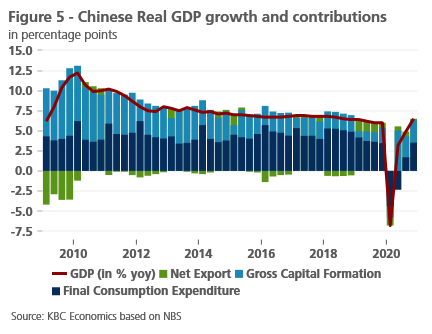
China’s economic recovery continues at a still swift pace with Q4 real GDP growing a faster-than-expected 2.6% quarter-on-quarter (6.5% year-over-year). This brings annual average growth in 2020 to 2.3%, which is a strong outperformance compared to other major economies. Notably, consumption contributed 3.5 percentage points to year-over-year growth, while investment contributed 2.8 percentage points (figure 5). Given that the early stages of the recovery in China were led by investment while consumption lagged, this further recovery in consumption is a positive signal for the momentum of the Chinese recovery going into 2021. However, some normalisation in the pace of growth should be expected going forward. We therefore maintain our GDP growth outlook of 8.5% in 2021 and 5.2% in 2022.
Recent concerns that monetary policy in China could be prematurely tightened, as reflected by a sharp jump in the overnight repo rate at the end of January, are likely exaggerated. A net liquidity withdrawal via open market operations ahead of the Spring Festival period (when demand for liquidity tends to be higher) helped spark these concerns. However, liquidity demand may be lower than normal this year given Covid-related restrictions on travel and the discouragement of large gatherings by the government. Comments by a PBoC advisor that pointed to risks of asset bubbles furthered concerns that tightening could be on the table.
However, other PBoC officials have since confirmed that China won’t face a sudden sharp change in policy. Indeed, we expect policy rates to remain stable this year, and although credit growth should decelerate somewhat, it will still remain supportive. The policy trade-off between moving the Chinese economy away from debt-dependent growth while still supporting the economy has been present for many years and remains a serious challenge going forward. A renewed focus on containing credit risks is therefore a welcome development for the long-term stability of Chinese growth, but as usual, we expect this focus to be targeted and measured, mainly through specific macroprudential policy instruments.
Stronger inflationary pressures in 2021
In line with the recent trend across commodities markets, oil prices have maintained strong bullish momentum in 2021. Brent crude surged to 60 USD/barrel, hitting the highest level in a year on the improving fundamental picture. On the demand side, the second pandemic wave has resulted in less-than-feared demand destruction so far, with weakness in Europe offset by resilient oil consumption in the US and China. Furthermore, a strong vaccine-led rebound in oil demand is expected later in the year and extending well into 2022 when global oil consumption is projected to fully recover.
On the supply side, the OPEC+ alliance continues to sharply restrain its output, withholding more than 7 million barrels per day from the global oil market. Moreover, Saudi Arabia announced a surprising unilateral production cut of an additional 1 million barrels per day in February and March, further limiting global supplies. This all leads to a tighter market balance in the first quarter, implying an ongoing drawdown of excess inventories accumulated in the first half of 2020.
Looking ahead, the oil market is set to rebalance further, owing to a strong rebound in oil demand and ongoing supply curbs from OPEC+. Against this background, we have materially upgraded our oil price outlook in 2021 with Brent crude now seen averaging 58 USD/barrel this year, a significant increase from 43 USD/barrel in 2020. At the same time, we see notable upside risks to the oil prices in the short term.
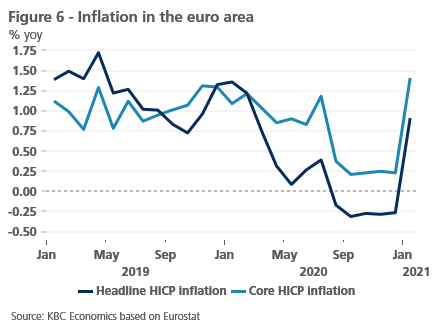
Higher oil prices have important implications for our inflation outlook. In the euro area, headline HICP inflation jumped to 0.9% yoy in January from -0.3% yoy in December, significantly above expectations. Similarly, core inflation spiked to 1.4% yoy from 0.2% a month earlier (figure 6). Stronger inflationary pressures reflect a number of technical and mostly one-off factors, including the reversal of the Germany’s VAT cut, the introduction of the carbon tax, and delays in winter sales in several countries, including France and Italy.
Furthermore, methodological changes to the HICP basket weights in 2021 (based on changes in consumption patterns observed in 2020) shifted inflation mechanically higher. Along with expectations of higher oil prices, this has prompted us to increase the inflation outlook by 0.3 percentage points to 1.3% in 2021. The inflation outlook for 2022 remains unchanged at 1.3%. Importantly, while we do see inflation moving up faster than previously envisaged, underlying price pressures are set to remain moderate over the longer term. This is a result of both cyclical influences and structural disinflationary forces, together implying an extended period of undershooting the euro area inflation target.
In the US economy, inflationary pressures are seen gradually building up. However, the January CPI reading which came in below consensus at 1.4% yoy still suggests underlying pressures remained modest as this year began. Following a drop in headline inflation to 1.2% seen in 2020, we have upgraded our inflation outlook for 2021 and 2022 to 2.4% (from 2.0% earlier) and 2.2% (from 2.0% earlier), respectively. A faster than previously envisaged rise in prices is primarily due to the higher projected energy prices, together with the risk of some upward pressures from fiscal measures. Apart from some emerging pandemic-related supply pressures (e.g. rising transportation costs), the latter is the main upside risk to our US inflation outlook.
A focus on ‘reflation’ in the context of a rebound in economic activity and exceptionally accommodative fiscal and monetary settings globally, related pressures on supply chains, the impact of sharply higher oil prices and some statistical issues all suggest the possibility of significant upward momentum in inflation globally in coming months. While our upward revisions to inflation forecasts reflect the reality of upside risks in this regard that may not yet be fully discounted, activity levels that remain below pre-pandemic levels and structural forces that have kept inflation subdued for some time suggest any step-up in price pressures will be contained. Nonetheless, concerns about inflation may increase in coming months.
1To exclude the influence of price changes, GDP is measured in fixed prices. The influence of seasonal fluctuations and calendar effects is also adjusted in the business cycle analysis.
Alle historische koersen/prijzen, statistieken en grafieken zijn up-to-date, tot en met 8 februari 2021, tenzij anders vermeld. De verstrekte posities en prognoses zijn die van 8 februari 2021.