
Economic Perspectives April 2024
Read the full publication below or click here to open the PDF.
- Geopolitical tensions drove up commodity prices last month. OPEC+ supply cuts, along with escalating Israel-Iran tensions, drove up energy prices in March and early April. Oil prices are now hovering around 90 USD per barrel (up from 82 USD in March). Gas prices increased by 9% to 27 EUR per MWh in March. Non-energy commodities also rose in March. Metal prices rose 2%, while food prices rose 1.3%. The sharp increase in gold prices was notable.
- Euro area inflation declined from 2.6% to 2.4% in March and remains on its downward path. Food inflation declined significantly, while energy inflation increased, but remains in negative territory. Core inflation declined from 3.1% to 2.9% thanks to a continued drop in core goods inflation. Services inflation remained constant at 4% and is now the prime contributor to euro area inflation. Given the surge in global energy prices, we increased our 2024 forecast from 2.4% to 2.6%, while maintaining our 2% 2025 forecast.
- US inflationary impulses remain too elevated. In March, inflation increased from 3.2% to 3.5%. Energy prices increased substantially, while food price inflation was moderate. Core inflation remained constant at 3.8%, halting the decline seen in previous months. Core increased by 0.4% on a monthly basis, due to strong services and shelter inflation. Goods prices declined thanks to lower vehicle prices. Consumer inflation expectations also increased markedly. We upgraded our inflation forecast for 2024 from 3.2% to 3.3%, while maintaining our 2.5% 2025 forecast.
- The euro area economy is showing timid early signs of improvement. Sentiment indicators have improved, but remain weak especially in manufacturing and construction, as monetary conditions remain tight. Consumer sentiment is also improving. The improvement is mostly observed in Southern European economies, while the German growth outlook remains weak. We slightly upgrade our 2024 forecast from 0.4% to 0.5%, while maintaining our 1.3% 2025 forecast.
- US economic performance remains healthy as US GDP grew by 0.4% quarter-on-quarter. Consumers keep spending, while manufacturing and government spending remains elevated. The US productive capacity is also increasing. The US added 303k jobs in March, while the unemployment rate declined, and the participation rate increased. Average weekly hours worked also increased. We thus maintain our 2.4% and 2% growth forecasts for 2024 and 2025 respectively.
- Diverging growth and inflation paths between the US and the euro area are likely to lead to diverging Fed and ECB policies. Given the strong US growth and inflation prospects, we now expect the Fed to start cutting rates in Q3 2024 at the earliest and only expect two rate cuts this year. In contrast, we still expect the ECB to start cutting rates in its June meeting, though we now only expect three rate cuts this year instead of four. On the back of an increasing interest rate spread, we also lowered our EUR/USD forecast.
- Chinese GDP growth surprised to the upside in Q1 2024. We therefore updated the 2024 outlook from 4.7% to 5.1%. However, structural problems remain, and there were signs of slowing momentum at the end of Q1. As such, our overall view on the Chinese economy is still cautious.
The US and the euro area have become economic polar opposites. The US economy keeps growing at a rapid pace as consumers and public authorities continue spending generously and the labour market keeps adding an impressive number of jobs. Strong demand and tight labour markets are supporting inflation, which increased slightly to 3.5% in March. The situation is very different in the euro area. Consumer and producer sentiment and consequently economic growth remain weak (especially in Germany). Consequently, the euro area’s inflation outlook is more benign as inflation declined to 2.4% in March. The diverging growth and inflation paths are also pushing the Fed and the ECB increasingly in different directions. We now expect the Fed to only cut rates two times this year, starting in Q3 at the earliest. In contrast, we expect the first ECB rate cut in June and expect the ECB to cut rates three times this year.
Energy prices rise in the wake of escalating Middle East tensions
Oil prices rose by 6% last month (to 86.7 USD per barrel) in the wake of OPEC+’s decision to lengthen supply cuts till June. Escalating tensions between Israel and Iran have pushed up prices to around 90 USD in April. A full-blown conflict between both countries could cause major disruptions in the oil market. Iran produces more than 3 million barrels per day and the country could threaten to disrupt shipping through the strait of Hormuz. 30% of global oil exports and 20% of gas exports flows through this strait. So far active diplomacy has contained escalation risks, and a full-blown conflict in the Middle East is not priced in in oil markets. Gas prices (TTF) also rose by 9% to 27 EUR per MWh in March. Prices remain close to historical averages thanks to well-filled EU gas reserves (currently at 62% of total capacity).
Non-energy commodities also rose last month. Metal prices rose 2% last month and 4.7% last quarter (see figure 1) as strong demand and supply disruptions drove up prices. The rise of gold prices was particularly notable. The precious metal rose 8.2% last quarter. Gold is widely seen as a safe haven in times of geopolitical tensions. Furthermore, central banks have increased their gold reserves as they try to diversify away from US dollars. China’s central bank purchased 160k ounces (worth 384 million USD) in March.
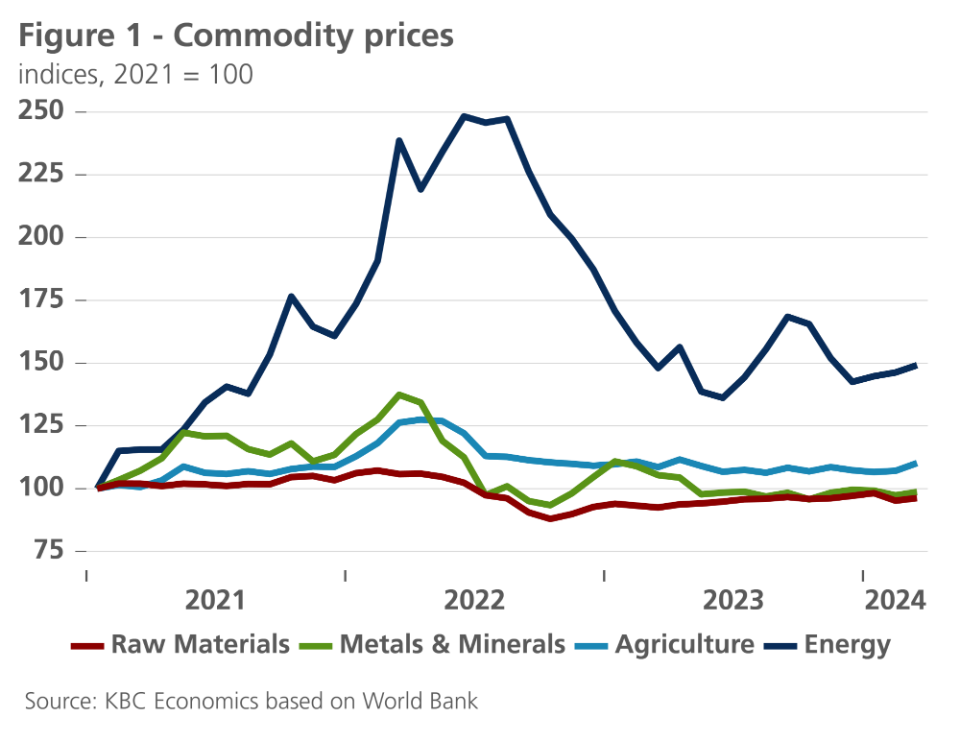
Food prices also rose last month (by 1.3%). Strong demand for vegetable oil, dairy and meat prices were the main contributors to the increase. In contrast, sugar and cereal prices declined due to better-than-expected harvests. Overall, food prices remain 9.9% lower than a year ago.
Further inflation decline in euro area
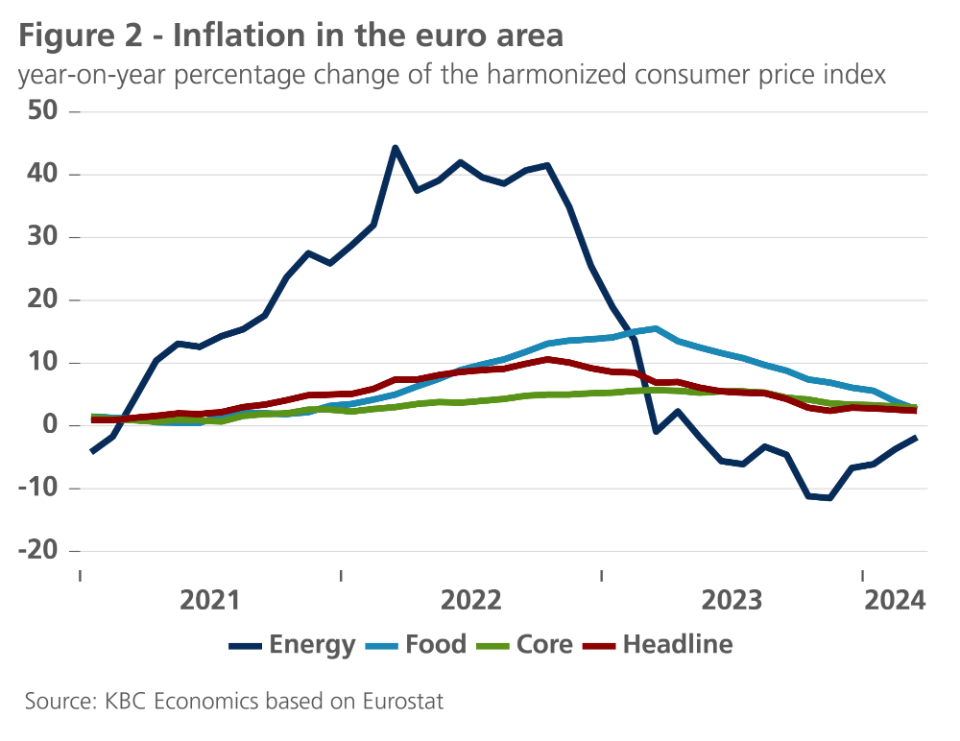
In the euro area, inflation fell by 0.2 percentage points in March as in February. It stood at 2.4%. Food price inflation in particular fell sharply (from 3.9% in February to 2.6% in March), while energy price inflation became significantly less negative (-1.8% in March versus -3.7% in February, and still more than -11% in October and November 2023 – see figure 2). Core inflation, which excludes food and energy prices, also declined by 0.2 percentage points and stood at 2.9% in March. However, this decline was solely due to the sharp cooling of the increase of non-energy goods prices. These were 1.1% higher in March than a year earlier. The cooling of services inflation is much more limited and seems to have stalled in the meantime. Services inflation stood at 4% for the fifth consecutive month in March, while their recent peak (in July 2023) was 'only' 5.6%.
That the cooling of services inflation would be slow and difficult was expected, as the catch-up of wages to past inflation keeps current wage cost pressures high. However, scant information on wage developments confirms that the pace of wage growth has not been accelerating and may have peaked. This corroborates our expectation of gradually further cooling core inflation. Meanwhile, the rising tension in the Middle East may well provide new upward momentum to inflation via higher energy prices (especially of oil). However, these would remain very temporary. Indeed, the downward trend of oil prices in futures markets remains broadly intact. This means that any upward inflationary pressure we could expect in the next few months is expected to be temporary. But it may add to the volatility of the inflation path in the coming months. Inflation paths are likely to become bumpy in the last mile towards the 2% inflation target.
Against this background, we maintain our expectation for core inflation, but have raised the expected energy price inflation in 2024, and consequently also our expectation for the average headline inflation rate. We expect an average inflation rate of 2.6% (instead of 2.4%) in the euro area. For 2025, we maintain our expectation of 2% inflation.
US inflation dynamics remain too strong to start easing
US inflation data continues to surprise to the upside. In March, US inflation increased from 3.2% to 3.5%. On a monthly basis, inflation increased by 0.4%. Within non-core components, energy prices increased by 1.1%. Another jump in energy prices is expected in the next months as recent oil price increases have yet to fully pass through to the CPI. In contrast to energy prices, food prices barely increased and are now only 2.2% higher than a year ago.
Core inflation also increased by 0.4% month-on-month (the third month in a row). Given this strong monthly increase, core inflation (slightly) increased for the first time since March 2023 and now stands at 3.8%.
Shelter inflation was a major driver behind this strong core inflation figure. Shelter prices increased by 0.4% last month and 5.7% versus last year, as housing supply remains constrained and housing demand is driven upwards by a surge in immigration. Though shelter price inflation has decelerated somewhat, it remains too elevated. Furthermore, forward-looking indicators suggest continued strong shelter inflation going forward as market rents increased by 1.3% last quarter.
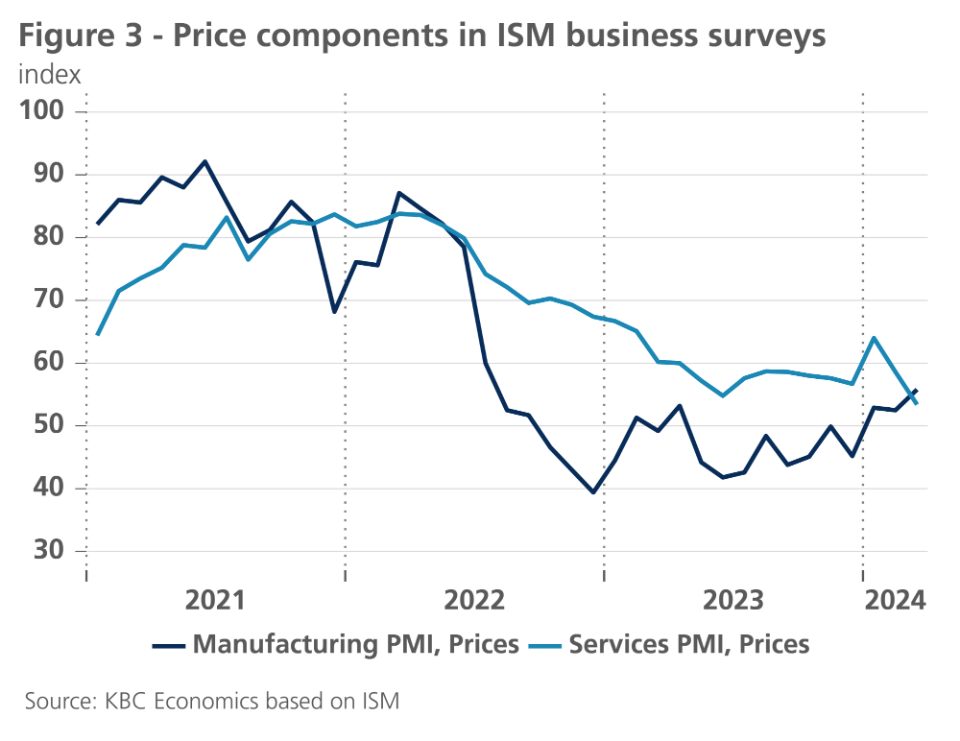
Core services (ex. shelter) inflation has risen at an even faster pace. Service prices rose 0.5% last month and have risen by 1.9% last quarter. Rising insurance prices were an important contributor to services inflation last month. We hope services inflation might soften in the coming quarters as wage inflation remains well behaved. Notwithstanding strong labour market data, average hourly earnings rose by only 4.1% year-on-year last month. Moreover, price sub-components in the ISM business surveys also suggest softer services inflation ahead (see figure 3).
In contrast to services and shelter inflation, core goods inflation declined by 0.2% last month. The decline was driven by a decline in vehicle prices (new and used ones). A strong dollar might keep core goods inflation in check in the coming months. Non-fuel import prices barely increased last month.
Unfortunately, the continued inflationary pressure has also impacted consumers’ inflation expectations which rose from 2.9% to 3.1% for the year ahead. We thus slightly upgrade our inflation forecast for 2024 from 3.2% to 3.3%, while maintaining our 2.5% 2025 forecast.
Higher inflation prints drive up bond yields
During the past month, global bond yields rose sharply. By mid-April, US 10-year government bond yields reached about 4.60% while the German yield rose more moderately to about 2.50%. As a result, the US-German bond yield spread rose substantially to a level not seen since the beginning of the pandemic in early 2020.
The main driving factor behind this upward move is the increasing uncertainty about the disinflation process towards the 2% target. The Fed was not convinced that this is just a ‘bump in the road’ of disinflation and that the trajectory towards its policy target would fundamentally continue.
The Fed is not in a hurry to ease
As a consequence, financial markets started to expect that the Fed’s first rate cut would be delayed until September 2024 at the earliest. Consistent with that, only one rate cut is now fully priced in for 2024. Moreover, the market expectation of the longer-term terminal rate during this rate-cutting cycle was sharpy revised upward to above 4%, which is substantially higher than the Fed’s current expectation (March ‘dot plots’) of 2.6%.
In our view, the disinflationary process in the US is fundamentally still on track, but there are clearly upside risks that could cause the US (core) inflation to remain more sticky. Moreover, bearing in mind the dual mandate of the Fed of price stability and maximum sustainable employment, the remarkable and persistent strength of the US labour market, in terms of high net job creation and low unemployment rate, means that from this perspective the Fed has no urgent need to cut its policy rate either. We therefore reduced our expectations for the number of Fed rate cuts in 2024 from three to two, which would bring the US policy rate to 4.875% at the end of 2024. It is also our assessment that the neutral real short-term interest rate in the US (r*) is under upward pressure, among other things because of the persistent, large US budget deficit and worsening debt position. We therefore also raise our expectation for the end of 2025 Fed funds rate by 25 basis points to 3.125%, which is less than the market expects but about 50 basis points higher than the Fed’s own expectation.
Our outlook for the ECB is different than for the Fed. Contrary to the US, there is less doubt about the continuation of the disinflationary path in the euro area. Therefore, the ECB communicated that, barring unexpected new shocks, the start of its rate-cutting cycle will normally be in June, even if that implies that the ECB will start easing sooner than the Fed. Our revised outlook for the Fed does have implications for the ECB, because the short and long-term interest rate differentials are weighing on the exchange rate of the euro against the dollar. The depreciation of the euro, all else equal, slows the disinflationary process in the euro area, reducing the potential number of rate cuts for the ECB. Consequently, we have reduced the expected number of rate cuts by the ECB in 2024 from four to three, which would bring the ECB’s deposit rate to 3.25% at the end of 2024. We leave our expectation for the policy rate at the end of 2025 unchanged at 2.50%, broadly in line with market expectations, implying a persistent increase in short-term US-EA interest rate differentials. Although we still expect the dollar to depreciate again from Q3 2024 for fundamental valuation reasons, this increased rate differential means the trajectory of the dollar exchange rate shifts to a stronger level, likely reaching 1.07 USD per EUR at the end of 2024.
Our adjusted outlook for short-term interest rates also has implications for our outlook for bond yields. In our view, the recent increase in US bond yields is fundamentally justified by the more hawkish outlook for the Fed. This not only refers to the reduced number of expected cuts in 2024, but perhaps even more importantly to the increase of our expectation for the terminal rate at the end of 2025. As a consequence, we still expect US 10-year bond yields to moderately ease in the course of 2024, but we have increased by 25 basis points the rate at which this decrease will end (to 4.25%).
Against this background, German bond yields are primarily affected by correlation with moves of US yields. Therefore, we maintain our expectation that the German 10-year yield will moderately ease in the course of 2024. Because of the fundamentally too-low value of the 10-year German bond yield, a moderate increase to 2.50% by the end of 2025 remains likely.
In sum, our interest rate scenario implies that both the US and German yield curves will remain inverted at least until the end of 2024 and become either upward sloping again in the course of 2025 (US) or later (Germany).
Sovereign spreads in euro area are still likely to moderately increase
During the past month, intra-EMU sovereign bond yield spreads versus Germany remained broadly unchanged. We confirm our outlook that these spreads are currently overly low, in line with a general environment of subdued risk premia (such as credit spreads and the euro area swap spreads). We expect the sovereign spreads in the euro area to increase gradually in 2024 towards a more fundamentally justified rate. The likely triggers for this increase remain the preparations for the 2025 budgets and political risks. The latter risks are related to the outcome of upcoming elections and political stability, as well as to uncertainty about the disbursement of EU funds. This could potentially also affect some member states’ credit rating.
Good news on euro area economy
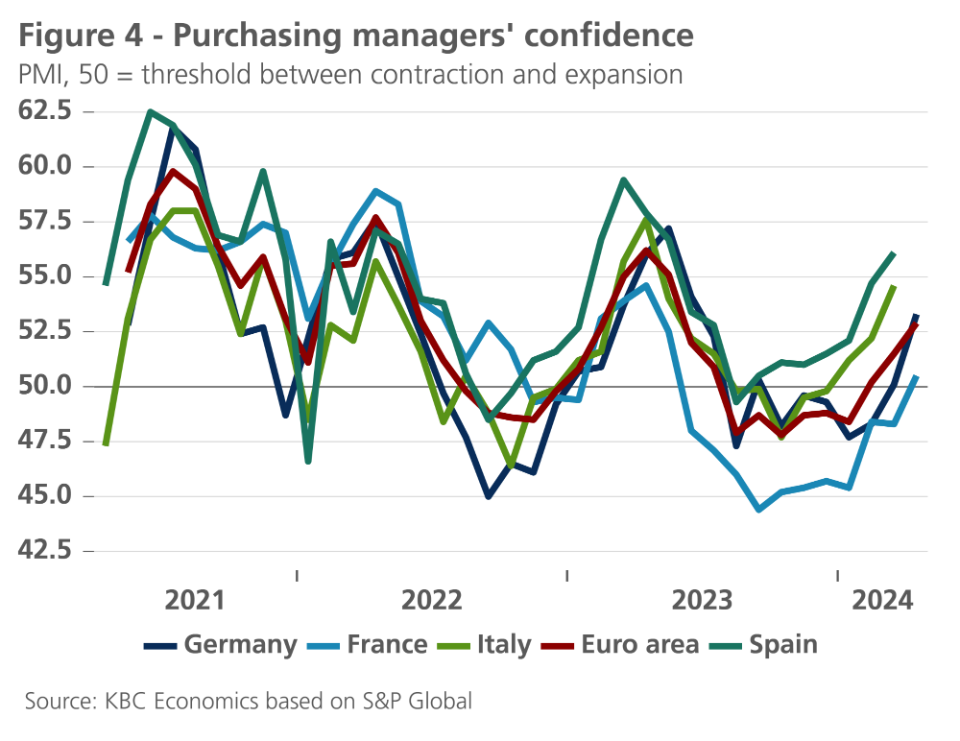
The composite purchasing managers' confidence index (composite PMI) rose to 51.4 in April 2024. This puts it for the second consecutive month above the threshold of 50, which is associated with the difference between economic contraction and expansion. This is undoubtedly good news and confirms our scenario that economic activity in the euro area will gradually regain momentum as 2024 progresses. But nuance and caution regarding expectations remain appropriate.
The confidence recovery is particularly noticeable in the services sectors. The relevant PMI made a striking remount in recent months from 47.8 in October 2023 to 52.9 in April 2024. The PMI's signal on confidence in services sectors thus comes more in line with signals from the European Commission’s (EC) confidence surveys, which pointed to a much less pronounced loss of confidence in the first months of 2023 and slightly improved on balance since mid-2023. Confidence trends in services also suggest that the expected growth recovery will come mainly from domestic demand, and more specifically private consumption (see below). It is also notable that – at least until March – service producer confidence in Spain and Italy is clearly higher and recovering more strongly than in Germany and France (see figure 4).
Confidence remains very weak in the construction sector, according to both the (March) PMI and the EC confidence indicator. But in most major euro area countries, the PMI also points to a gradual improvement in the more internationally oriented manufacturing sector, with Germany nevertheless the exception. After six months of recovery – though deep in the contractionary zone – the German manufacturing PMI fell again in March for the second consecutive month to the October-November 2023 level, and barely recovered in April. Fortunately, in March 2024 the ifo-indicator signaled improving confidence, including in the German manufacturing industry. In February-March, German entrepreneurs were becoming significantly more optimistic about near-term dynamics. This suggests that the economic malaise in Germany - the current problem child of the European economy - will gradually be overcome.
Meanwhile, consumer confidence is also recovering, both in the euro area as a whole and in Germany. After faltering in January, there was another improvement in February and March. In the ECB's recent Bank Lending Survey, banks signaled a stabilisation in credit demand from households and expect an increase in demand for both consumer credit and (especially) home loans over the next three months. Together with the purchasing power recovery in wages, these elements also suggest that the pre-conditions for a gradual rebound of economic growth during 2024 via a consumption recovery become fulfilled.
We therefore maintain our scenario that the still difficult first half of 2024 will be followed by a gradual strengthening of growth. Given the strong confidence recovery in the Spanish and Italian service sectors, we slightly increased our expected growth rate for the euro area in 2024 from 0.4% to 0.5%. We maintain the expected growth rate for 2025 at 1.3%.
US economy is still in good shape
The US economy grew by 0.4% in Q1 2024. Though this was below our expectations, it is still strong compared to its peers. Consumers seem to be keeping their spending tabs open as retail sales increased 0.7% month-on-month in March. But these figures should be interpreted cautiously as the January sales were actually very poor.
Meanwhile, the manufacturing sector is showing signs of improvement. The ISM manufacturing survey increased from 47.8 to 50.3 in March, putting it out of contractionary territory. Manufacturing output also increased by a solid 0.5% month-on-month in March.
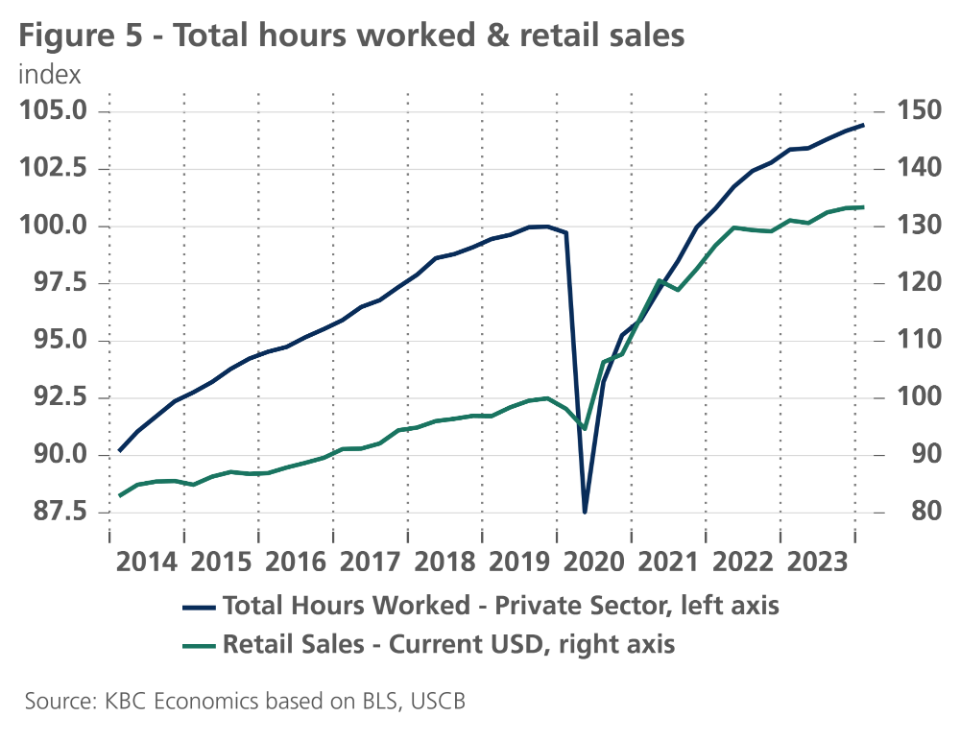
The health of the labour market also remains remarkable. The US economy added 303k jobs in March and we even saw some upward revisions to jobs data of earlier months (unlike prior labour reports). The unemployment rate declined slightly to 3.8%, while the participation rate rose from 62.5% to 62.7%. The average workweek also ticked up to 34.4 hours. These strong figures have pushed up the total hours worked in the US (see figure 5) and allowed the US economy to accommodate a large part of excess demand without a major surge in inflation.
As this strong US economic performance was largely expected, we were able to maintain our 2.4% and 2% growth forecasts for 2024 and 2025 respectively.
Positive GDP surprise in China
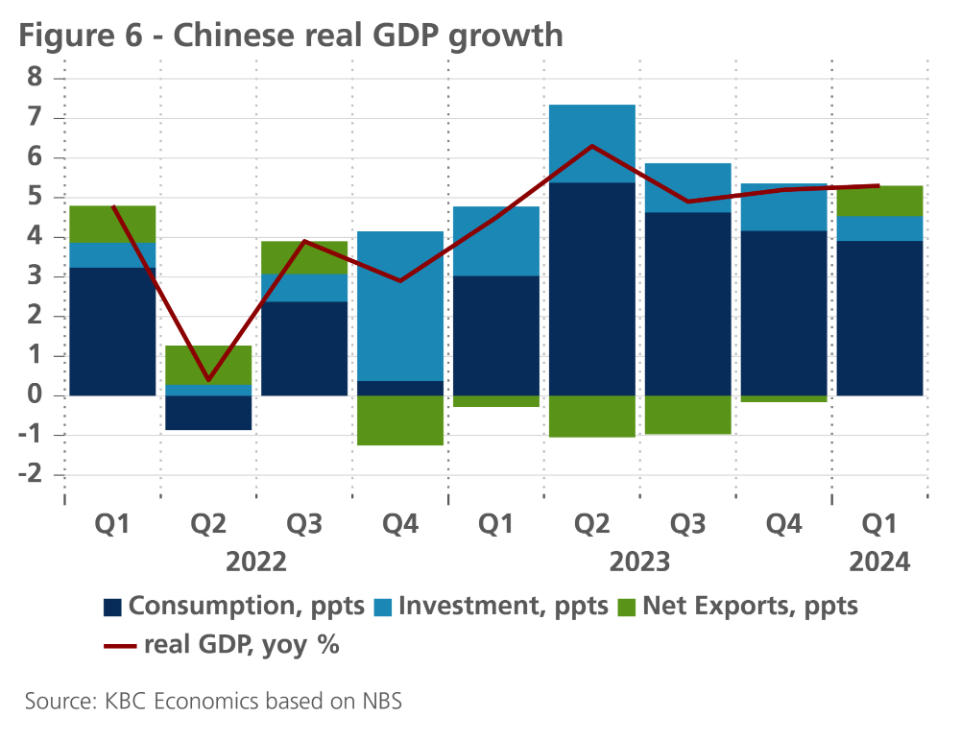
Chinese GDP growth surprised to the upside in Q1 2024 at 1.6% seasonally adjusted quarter-on-quarter or 5.3% year-on-year, setting the stage for the government to reach its 2024 growth target of 5%. But once again, reaching the headline growth figure doesn’t reveal much about the underlying health of the Chinese economy. Growth in the first quarter was supported especially by net exports (see figure 6). Exports grew on average 3.4% year-on-year in the first quarter (measured in CNY), but in March alone, exports declined 3.8% year-on-year, suggesting momentum may be slowing.
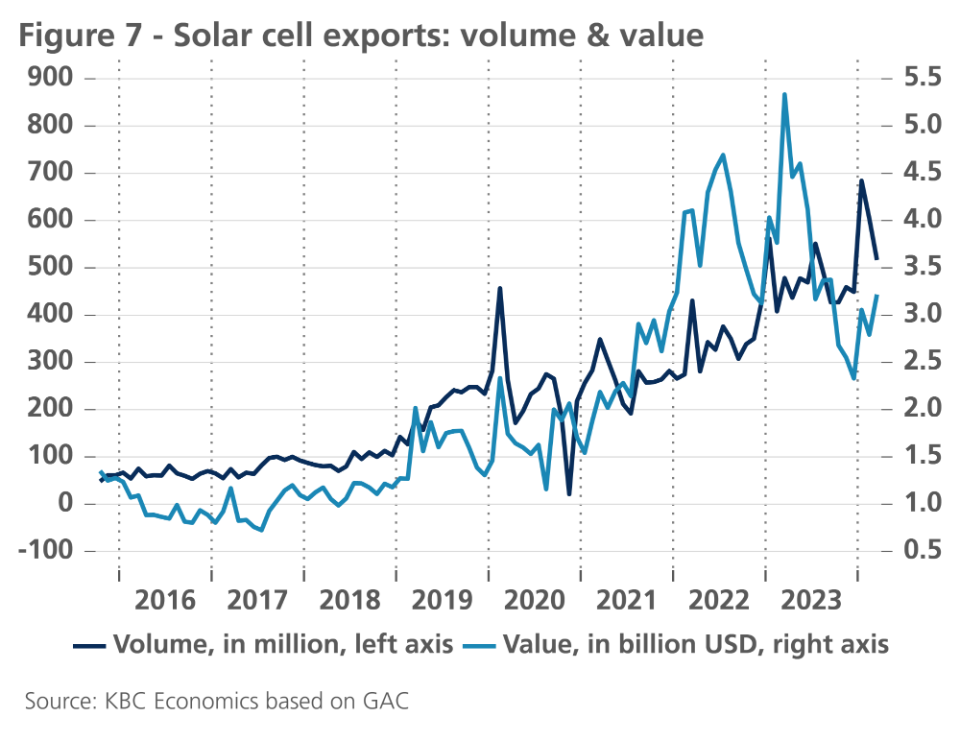
Furthermore, strength in China’s export-facing manufacturing sectors also reflects increased support from state-owned enterprises (SOEs) toward higher-tech and higher-value added industries as part of China’s long-term goal of industrial upgrading. In March 2024, for example, fixed asset investment by SOEs grew 7.8% year-to-date year-on-year, while private investment grew a meagre 0.5% year-to-date year-on-year. While industrial upgrading is a positive development in terms of China needing to find new drivers of growth, the ramp up in industrial activity, at a time when consumer sentiment remains extremely weak, is leading to supply-demand imbalances domestically and driving exports (including exports of green-tech) at lower prices (see figure 7). The fact that the EU has opened a number of investigations into China’s state subsidy practices in recent months to determine whether state support is unfairly undercutting EU industries, particularly green industries, reveals that China’s trading partners may start pushing back against China’s exporting edge. This is also reflected in Trump’s plan to impose new tariffs on Chinese goods if he retakes the US presidency in November. China, therefore, still needs to improve domestic demand if it wants to get back on a more sustainably strong growth path.
This is not to say there’s no good news in the data. While private investment growth remains weak, especially compared to SOEs, it improved during the first quarter of the year, turning positive after contracting for all of H2 2023. Business sentiment indicators are also generally positive (above 50) and improving for both the manufacturing and service industries. And although strong industrial production in previous months may be losing some momentum (contracting -0.8% month-on-month in March), retail sales picked up in March to 0.26% month-on-month after more-or-less flat growth in January and February. Therefore, given the overall upward surprise to Q1 GDP growth, we have upgraded our 2024 GDP outlook from 4.7% to 5.1%. However, we have downgraded, modestly, expectations for quarterly growth throughout the rest of the year, which due to carry-over leads to a downgrade of 2025 annual growth from 4.2% to 4.0%. Meanwhile, inflation still points to deflationary pressures in the economy, and we have slightly modified the 2024 average annual inflation forecast from 0.7% to 0.5%.
All historical quotes/prices, statistics and charts are up-to-date, up to 22 April 2024, unless otherwise stated. Positions and forecasts provided are those of 22 April 2024.