
Economic Perspectives December 2018

Read the publication below or click here to open the PDF
- Global weakness in the manufacturing sector remains an important growth-restraining factor in the fourth quarter. Although corporate sentiment indicators such as PMIs are still pointing towards expansion in most countries, the continued downward trend since the beginning of this year indicates waning growth momentum across the globe.
- The slump in business sentiment has been most noticeable in the euro area. After reaching multi-year highs at the end of 2017, which was also reflected in excellent GDP growth figures at the time, corporate optimism in the manufacturing sector has dropped markedly. Overall, we can say that euro area growth momentum has waned compared to the extraordinary good results in 2017. But we shouldn’t be overly pessimistic. The surprisingly weak growth performance in Q3 2018 was in large part due to temporary problems in the automotive industry and the outlook for more domestically oriented sectors still remains positive.
- Despite the euro area’s weakening growth and a slight decline in headline inflation, following the recent oil price decline, the ECB will end its asset purchase programme this month. However, European monetary policy is set to remain very accommodative for some significant time.
- The US economy remains resilient to global developments. Corporate confidence in both the services and manufacturing sector increased in November according to the ISM indicator, staying at very high levels. Also on the consumer side, things point to another strong GDP reading in Q4.
- The recently announced 90-day ceasefire in the ongoing US-China trade war may provide some short-term relief, but will likely not produce a long term solution as structural issues are too complex to tackle in such a short timeframe. As inflationary tendencies keep building up in the US economy, we expect the Fed to continue its gradual tightening path.
- Focus article - It’s not all sunshine and roses on the European labour market
Manufacturing weakness continues...
Global weakness in the manufacturing sector remains an important growth-restraining factor in the fourth quarter. The main reason appears to be a downswing in the international trade environment, which is persistently weighing on sentiment and export orders activity. Although corporate sentiment indicators such as PMIs are still pointing towards expansion in most countries, the downward trend since the beginning of this year indicates a waning growth momentum across the globe. Among the four major world economies, the slump in business sentiment has been most noticeable in the euro area. After reaching multi-year highs at the end of 2017, which was also reflected in excellent GDP growth figures at the time, corporate optimism in particular in the manufacturing sector has dropped markedly.
Compared to levels at the start of 2018, sentiment in the services sector has declined too, but the change was much less pronounced. Moreover, the European Commission’s Business Confidence Indicator also shows a less marked downtrend. Hence, overall we can say that euro area growth momentum has waned compared to the extraordinary good results in 2017. But we shouldn’t be overly pessimistic. The surprisingly weak growth performance in Q3 2018 was in large part due to temporary problems in the automotive industry (see below). Moreover, labour market performance remains robust and consumer confidence is still at healthy levels. This suggests that the outlook for more domestically oriented sectors remains positive. Therefore, we stick to our forecasts of above-potential growth for 2018 and 2019. Despite these positive features, our euro area 2018 growth forecast is revised slightly down from 2.0% to 1.9%, reflecting the weak Q3 growth figures as well as the temporary nature of the automotive supply side problems.
…affected by European car industry issues…
The disappointing third quarter real GDP growth rate in the euro area, and in particular in Germany, was mainly due to the weak performance in the manufacturing sector. Contrary to what might be expected, we don’t think the trade war was the main cause of these weak results (also see KBC Economic Opinion of 26 November 2018). Growth was disturbed by the fact that on 1 September 2018 a new passenger car fuel consumption and emission test procedure (WLTP) came into force for all cars. The new test procedure was already in place for new car models, but for older models (launched before September 2017) this created uncertainty. The fuel consumption and emission values of these cars could change as a result of the new tests. Depending on the environmental regulations and taxes in the different European countries, their use could be limited (e.g. no access to low emission zones) or become more expensive (due to higher taxes).
The 31st of August was the last day on which older car models could be put into circulation based on their test results under the old test procedure. As a result, the number of registrations of new passenger cars in the EU increased significantly in August (figure 1).
Figure 1 - New passenger car registrations (% change year-on-year, sa)
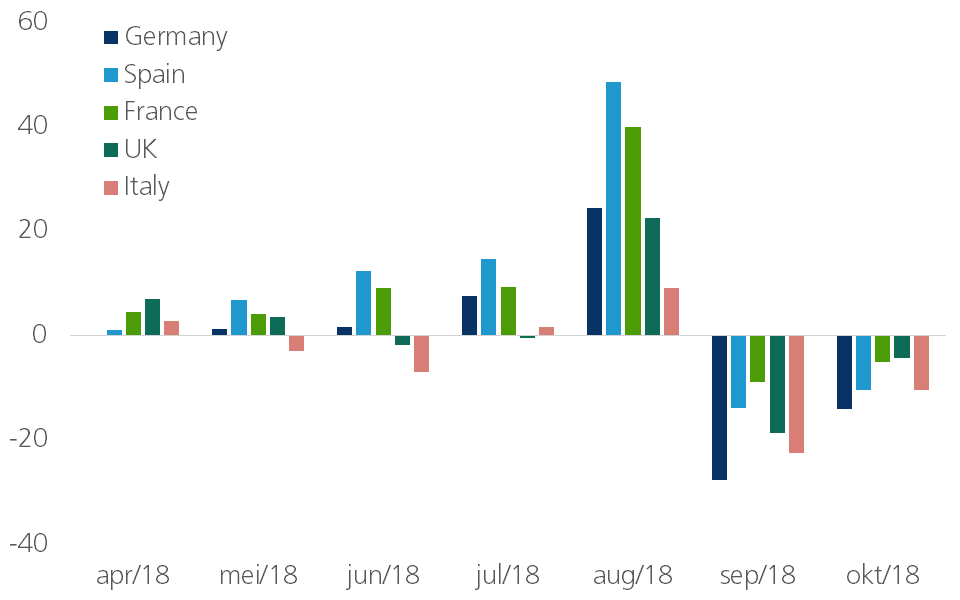
Many, mainly professional, buyers pushed their purchases forward because many older car models were sold at reduced prices in August. Consequently, in the months thereafter, registrations fell sharply. This was not only a correction of the August spike, but also due to the fact that some carmakers, mainly in Germany, failed to obtain the necessary WLTP test certificates in time. As a result, certain models could no longer be sold. The general uncertainty surrounding the new test procedure also caused delays in the production process and made consumers reluctant to buy new cars. Particularly the German economy was badly affected. This is the main explanation for the 0.2% drop in German real GDP in the third quarter. Car sales not only fell in the domestic German market,but also in other European markets. This led to a drop in German exports within the EU. It is worth noting that German exports outside the EU continued to grow in the third quarter, despite tensions in world trade.
According to IFO data, sentiment in the German car sector and the broader industrial sector as a whole, which deteriorated significantly in July and again in October, improved somewhat in November. However, the majority of survey respondents remain less optimistic about the future than they were in 2017. The drag from WLTP regulation will likely gradually fade in Q4, but some impact is still to be expected as car firms are selling the stock of cars that accumulated due to the sales disruptions. Nevertheless, we expect to see a recovery in industrial activity and growth for Germany and other euro area countries during Q4 and at the start of 2019.
… but US remains the exception
The US economy has remained extremely resilient to softer global developments of late. Corporate confidence in both the services and manufacturing sectors increased in November according to the ISM indicator, staying at very high levels. On the consumer side, things point to another strong GDP reading in Q4 as well. October personal spending gathered speed, supported by solid income growth and a decline in households’ savings rate since the beginning of the year. Consumer confidence, although slightly down in November, is still at historically high levels. Together with continued solid results from the labour market and increased wage pressures, this suggests that private consumption will again be one of the key drivers of US GDP growth in the coming quarters. The strong inventories increase in Q3 - most likely due to frontloading of American importers to avoid higher input prices as a result of import tariffs - is not an immediate cause for great concern (also see KBC Economic Opinion of 21 November 2018). However, further inventory developments need to be monitored as they might be a warning signal of a demand slowdown. Nevertheless, the US economy remains in good shape for now. Therefore, our US GDP growth projections are unchanged at 2.9% for 2018 and 2.5% for 2019.
Given these strong fundamentals in the US economy, we also hold on to our scenario for the Fed’s monetary policy path. In our view, the dovish repositioning by financial markets in response to recent communication by Fed Chairman Powell was somewhat overdone. Markets are currently discounting only one rate hike next year while economic data are not pointing towards any sudden change of course by the Fed next year. We interpret Fed Powell’s statement that interest rates are “just below” neutral, meaning neither speeding up nor slowing down growth, more as a correction of earlier statements rather than a fundamental change in overall communication. As already mentioned, economic data confirm this: activity indicators remain strong, the US labour market is tightening and the maximum employment goal is achieved while inflation remains above the 2% target that signals price stability. For these reasons, we don’t expect the Fed to significantly change its projections at the December FOMC meeting. Our scenario envisaging one more rate hike later this month and four more rate hikes in 2019 remains in place.
US housing market slowdown but no slump
In recent months, concerns about a slowdown in the US housing market have sparked worries that the sector might be a leading indicator of economic problems ahead of us. The relatively weak US housing data of recent months - with faltering construction activity, weakening confidence indicators and declining home sales (figure 2) - could be interpreted as flashing warning lights.
Figure 2 – Relatively weak US housing data in recent months
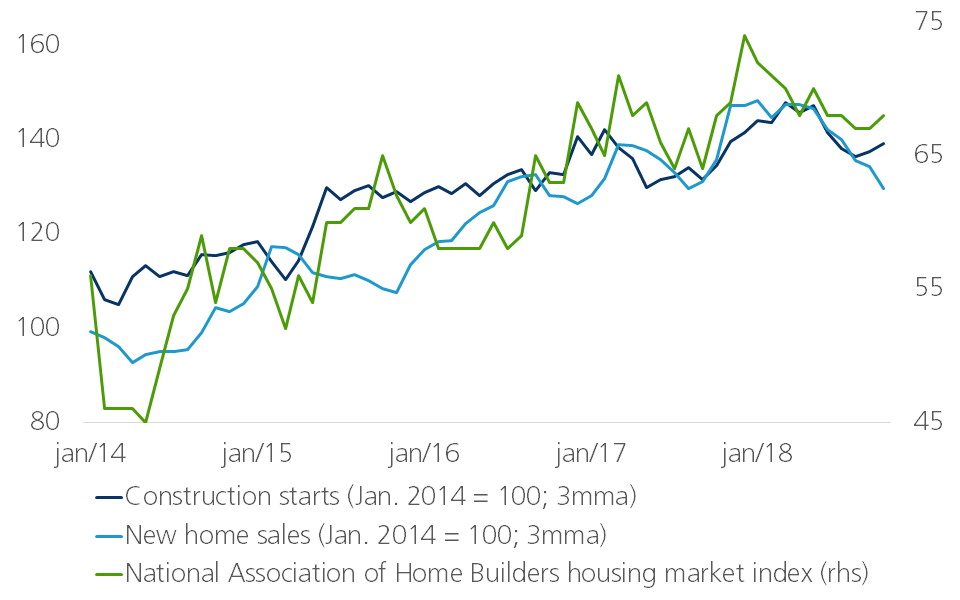
However, these developments should not be overstated as indicators have often been quite volatile in the past and are still at a relatively high level. The weakness, moreover, is not really in line with the general optimism in the US economy. Strong labour market performance actually speaks in favour of rising construction spending.
One possible reason for the housing market slowdown is a sharp rise in building materials prices (+5/6%). Additional tariffs on wood imports from Canada and on steel imports play a role here. Moreover, financing has become noticeably more expensive. Since September 2016, the average interest rate for the typical 30-year mortgage has risen by 1.3 percentage points. A more structural influence dampening growth in the construction sector is a worsening demographic outlook. While the 2014 projections contained a population growth of 2.6 million people per year, the latest figures indicate that the population will increase by just under 2.3 million per year over the next decade. We think this is likely due to lower immigration and partly to a lower projected birth rate.
Rising costs and interest rates will likely limit construction activity for some time to come. Hence, construction is unlikely to become a noticeable driver of US economic growth again soon. However, a sharp slump in housing activity, and the housing market in general, is not expected either. A 2008-style systemic collapse is very unlikely, as most mortgages are now lent at fixed rates and borrowers are required to show more evidence of their capability to repay their lenders. Although housing affordability declined as mortgage rates rose in tandem with the 10-year Treasury yield, it remains elevated, in part thanks to the drastic improvement in the labour market. Moreover, the household debt ratio has fallen sharply to below 70% of household income and well below its long-term trend. Additionally, mortgage delinquency rates are still at pre-financial crisis lows, illustrating the health of the mortgage market. Consequently, the rise in house prices will likely continue, but at a somewhat slower pace.
Trade war truce…for now
At the recent G20 meeting, US President Trump and Chinese President Xi agreed upon a temporary ceasefire in the ongoing trade war between the two countries. A further trade war intensification was suspended as new tariffs were precluded and trade negotiations were restarted for the next 90 days. This means that the US tariff rate increase from 10% to 25% on USD 200 billion of products coming from China - planned to be implemented in January 2019 - will not take place. However, if there’s no sufficient progress in the negotiations, the tariff increase will still be implemented in March 2019. China promised to purchase additional US products in a “very substantial” amount in order to reduce the bilateral trade balance, starting with the immediate purchase of more agricultural products. As such, the short-term the risk of a further escalation of the conflict has been averted.
Despite this temporary truce, the trade war is far from over in our view. The 90-day timeline is likely far too short a time period to agree upon deeply divisive structural issues such as the protection of intellectual property, non-tariff trade barriers and trade in agricultural products. It’s questionable whether Chinese authorities will be willing to make substantial concessions to US concerns. As one of the main goals of the current Chinese political leadership is to ensure political and economic stability, a full or speedy transition towards a market economy with no government involvement in the protection of certain industries is highly unlikely. Furthermore, the recent arrest of the chief financial officer of Huawei, a Chinese telecom company, following an extradition request by the US over alleged violations of Iran sanctions, signals that this trade war is actually also a technology war (also see KBC Economic Opinion of 11 April 2018). The ceasefire is hence probably just a pause in the US-China conflict of which the end is not yet in sight.
Meanwhile, US trade balance developments haven’t been what President Trump was hoping for. The total monthly US trade deficit for goods trade has been increasing since the summer - reaching USD 78.1 billion in October. The trend in bilateral goods trade between the US and China is even more painful for Trump. Since taking office in the White House in January 2017, the deficit has only been increasing. Accumulated over the past 12 months, the bilateral deficit rose towards more than USD 410 billion (Figure 3).
Figure 3 - US trade balance (goods trade, 12 month moving sum, in billions USD)
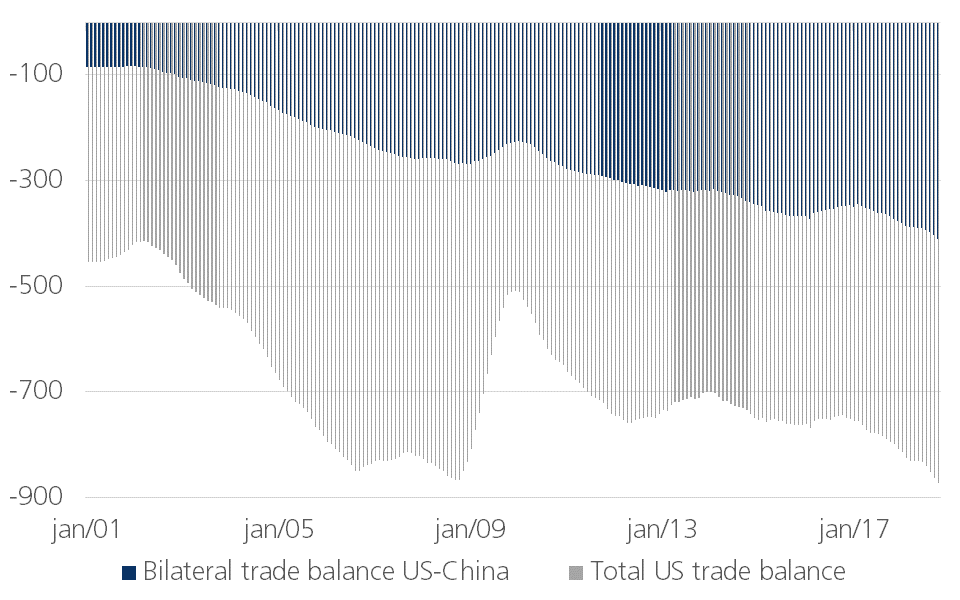
This accounts for almost half of the total US trade deficit. The rise in the deficit mainly reflects higher US imports that have been driven by fiscal stimulus led domestic demand. In that sense, the poorer trade deficit is due to Mr Trump’s own policy initiatives.
Now that the US-China trade storm is temporarily calming down, President Trump again has the opportunity to focus more on other trade issues. His recent tweets suggested that he might be preparing to impose import tariffs on cars and car parts. This would be significantly harmful for the euro area economy and in particular for Germany. The risk of a trade conflict escalation to the EU automotive industry has hence become larger.
Brexit uncertainty
Continuing twists and turns in Brexit negotiations between the UK and the EU are both an important source of uncertainty in relation to the outlook for the European economy and a symptom of deep rooted problems aligning coherent economic policies and populist agendas.
The UK referendum vote in 2016 to leave the EU was carried by 52% to 48%. This narrow margin reflects deep divisions within UK politics - and, more generally, within British society - that make agreeing the future relationship between the UK and EU exceptionally difficult for the UK Government. There is no majority within the UK parliament for a specific form of future relationship but there appears to be a blocking majority against most options at present. It seems unlikely that the EU will be able to provide alterations to the draft withdrawal agreement sufficiently strong and far-reaching to deliver majority backing for the deal in the UK parliament.
Although there is a majority within the UK parliament against a ‘no deal‘ Brexit, with the clock ticking towards the scheduled March 29th 2019 exit date, the risk is that the path (or cliff) taken occurs by accident rather than design. This means markets are now struggling with binary outcomes with very different implications for the UK and many EU economies in the shape of either a ‘soft and slow’ Brexit or the chaos that would follow from the UK crashing out of the EU in just three months’ time.
If the draft deal between the UK and EU can be agreed by the UK parliament or a decision is taken by the UK to withdraw the Article 50 declaration of its intention to leave, the likelihood is that economic ties between the UK and the EU will remain relatively close and the transition to new and likely still close structures will not take place for two more years. In such circumstances, any Brexit impact on the UK or EU economies in 2019 will be modest even if continuing uncertainty about the nature and extent of future ties between the UK and the EU and related political difficulties in the UK may imply some modestly negative impacts on the pace of growth in activity and employment on both sides of the English channel and on both sides of the Irish sea.
If instead, no deal is agreed and the UK ‘crashes out‘ of the EU at the end of March 2019, the impact on the UK economy will be overwhelmingly negative and will have significant adverse repercussions for many if not most EU economies. The unprecedented nature of a ‘no deal’ Brexit makes quantifying the likely short-term effects on EU economies highly speculative. At the aggregate level, a material hit to growth is likely. However, at least as important, is the prospect of marked variations in sectoral and national impacts and the threat of unexpected outcomes that reflect increasingly complex supply chains and demand linkages in a range of European industries. While a ‘no deal’ Brexit is not the most likely outcome, the economic risks it poses and the political fault lines it exposes means it looks set to be a key focus for markets into early 2019.
Oil market overshooting to the downside
The sharp oil price drop in recent months, falling from above USD 85 per barrel for Brent oil at the beginning of October to around USD 60 per barrel at present, came rather unexpectedly (also see KBC Economic Opinion of 5 December 2018). In our view, these movements contained some overshooting due to several supply side factors such as the drop in Iran oil exports due to US sanctions. Hence, in the short-term there should be a partial reversal that will lift the oil price back to USD 68 per barrel Brent by end-2018. The decision of the Organization of the Petroleum Exporting Countries (OPEC) and Russia to reintroduce production cuts will prevent oversupply in 2019 and keep oil prices broadly flat around USD 70 per barrel.
The drop in oil prices is probably good news for the US and European economy as it provides some (temporary) boost to consumers’ purchasing power and reduces business costs. Hence, the ongoing low-inflationary growth cycle could last somewhat longer than previously expected as lower fuel costs put some downward pressures on the headline inflation outlook. Given the somewhat lower path of the oil price, the recent small undershoots in US inflation figures (figure 4) and the fact that our forecasts were significantly above consensus, we have marginally lowered our US inflation projections for this and next year by 0.1 percentage point.
Figure 4 – US inflation measures (% change year-on-year)
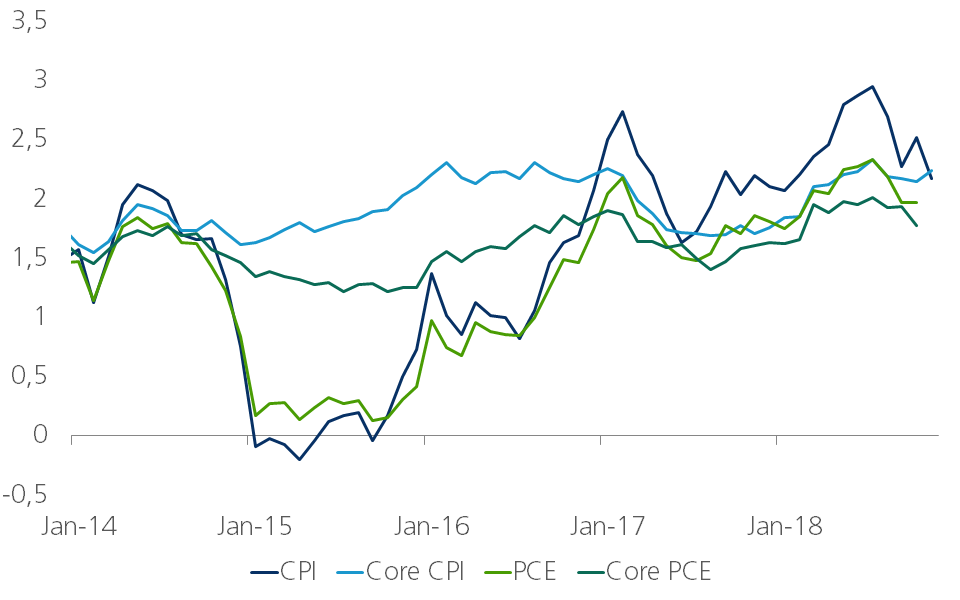
Nevertheless, with inflation forecasts for 2018 and 2019 at respectively 2.4% and 2.5%, we still are above consensus. This is consistent with our expectation of four rate hikes by the Fed in 2019, on top of one more hike later this month.
Safe haven flows in uncertain times
Financial markets concerns about a number of ongoing risk factors have heightened in recent weeks. It is difficult to tell whether it is the escalation of the US-Chinese trade/technology war, the Brexit drama or the Italians’ persistent stubbornness in their budgetary conflict with the European Commission that is causing the largest worries. There is, however, little doubt that the coincidence of worries across a range of fronts is significantly amplifying market nervousness. The fact remains that the future is very uncertain in many respects. While some economies are still recovering from the previous crisis and unconventional monetary policies are being slowly phased out, the chances of another correction in the economy are increasing. In that environment, it is not surprising that investors are fleeing to safe havens. As a result, the 10y German and US bond yield dropped again, after an earlier cautious rise a few months earlier. From a macroeconomic point of view, one would expect an upward yield trend. Although uncertainty and declining optimism are currently throwing a spanner in the works, our longer-term view remains unchanged.
The latest update of Q3 growth figures confirms the continued strong growth performance in Central and Eastern Europe (Figure CEE). The long-term catching up process with other EU member states continues, despite international risk factors and particularly tight labour markets. Despite the overall good growth performance, growth is supported by various factors in different countries. In general, domestic consumption and investments contribute substantially to growth. In many countries also net exports contributed to growth in Q3. In particular, the use of EU funding contributed too.
Figure CEE - Real GDP growth (% change quarter-on-quarter, seasonally adjusted)
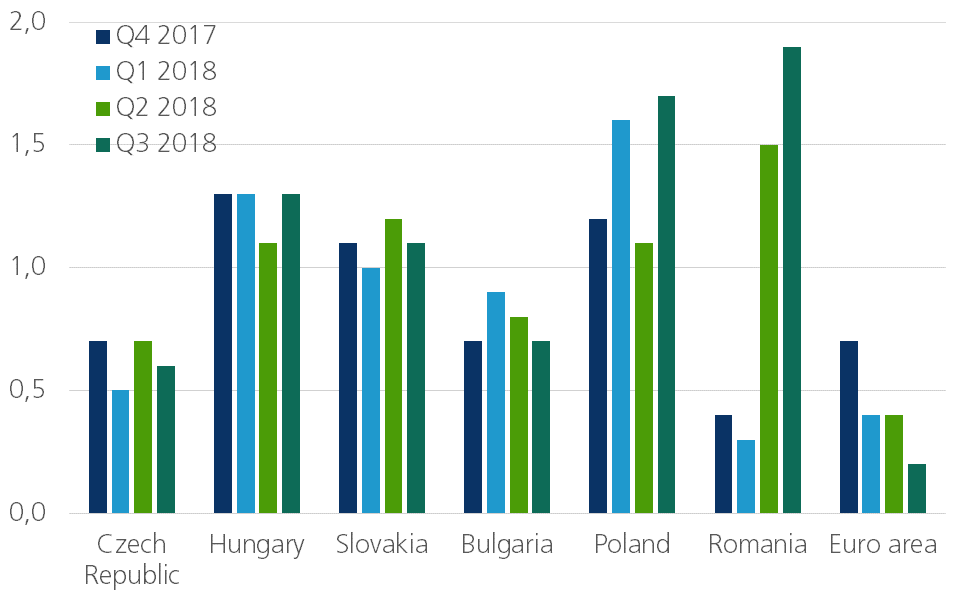
One of the superstars in the region is again Poland, with a predicted 5% real GDP growth for this year. Three factors explain the Polish outperformance. First, efficient utilization of EU structural funds, converted into strong construction and investment activity. Second, households’ spending supported in addition to record low interest rates by generous social allowances for families with children. Third, liberation of visa policy for Ukrainian workers, whose inflow mitigates domestic labour shortage.
Curiously enough, the regional growth star shows at the same time the lowest inflation figure in the region. In October, the HICP equalled 1.3% in Poland, while the corresponding figure for Hungary was 2.8% and 2.5% for Slovakia and Bulgaria. As for the future, lower oil and food prices together with permanently low core inflation are likely to keep Polish inflation below the NBP target throughout 2019. Consequently, the National Bank of Poland is expected to keep its policy rates unchanged.
Despite the overall good growth performance, not all countries in the region performed equally well in Q3. Czech GDp growth decelerated somewhat, partly caused by issues in the automotive industry, while Czech inflation stabilized at 2.1%.
Amidst speculations about the definitive shape of the Brexit (dis)agreement, we may ask, how seriously would Central and Eastern Europe be hurt by the increasing trade frictions and whether these friction could change the regional ranking of the growth performers. In order to answer the question, we ran a simple analysis simulating a demand shock to the CEE with the help of world input-output tables that give detailed information about interconnections of industries across the countries. The analysis revealed that the most vulnerable among CEE markets is Slovakia, where a 25% fall in final UK demand for EU exports may trigger a fall in gross value added by more than 0.4%. Next follow the Czech Republic (0.37%), Poland (0.31%) and Hungary (0.27 %). Romania and Bulgaria in contrast, show a much lower sensitivity (0.16% and 0.14%, respectively).

All historical rates/prices, statistics and graphs are up to date, up to and including 10 December 2018, unless otherwise stated. The views and forecasts provided are those prevailing on 10 December 2018.