Central and Eastern Europe

Central and Eastern Europe

Most recent Economic Perspectives for Central and Eastern Europe

What is driving the regional rebound in consumption?

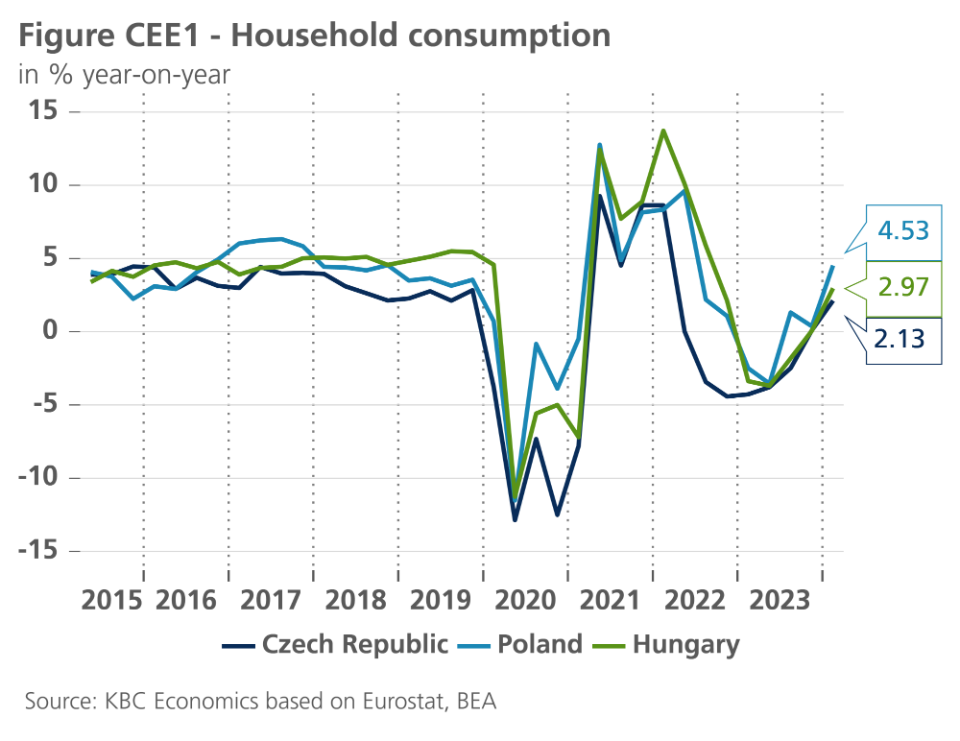
The significant increase in real wages is fuelling domestic demand across the CEE region with Poland being the leader (year-on-year growth in consumption at 4.5%, see figure CEE1). CEE households have taken advantage of a sharp decline in inflation, which has come down from double digit levels a year ago to almost 2.5% in Poland and the Czech Republic and 4% in Hungary. Meanwhile, nominal wage growth persisted at elevated levels and, as a result, real wage growth has risen by more than 9% in Poland and close to 5% in the Czech Republic in Q1 2024. Hungarian figures for Q1 have not been published yet, but real wage growth is not expected to fall significantly from the latest 8.3%.

Looking ahead, real wage growth should probably continue to support consumption in the upcoming quarters as well. Simultaneously in the Czech Republic, the decline in interest rates can reduce the excessively high savings ratio (approx. 19% compared to a 12% long run average) and further boost consumption. This is not going to be the case in Poland, where interest rates stay stable and the savings ratio is relatively low (low single digit values).

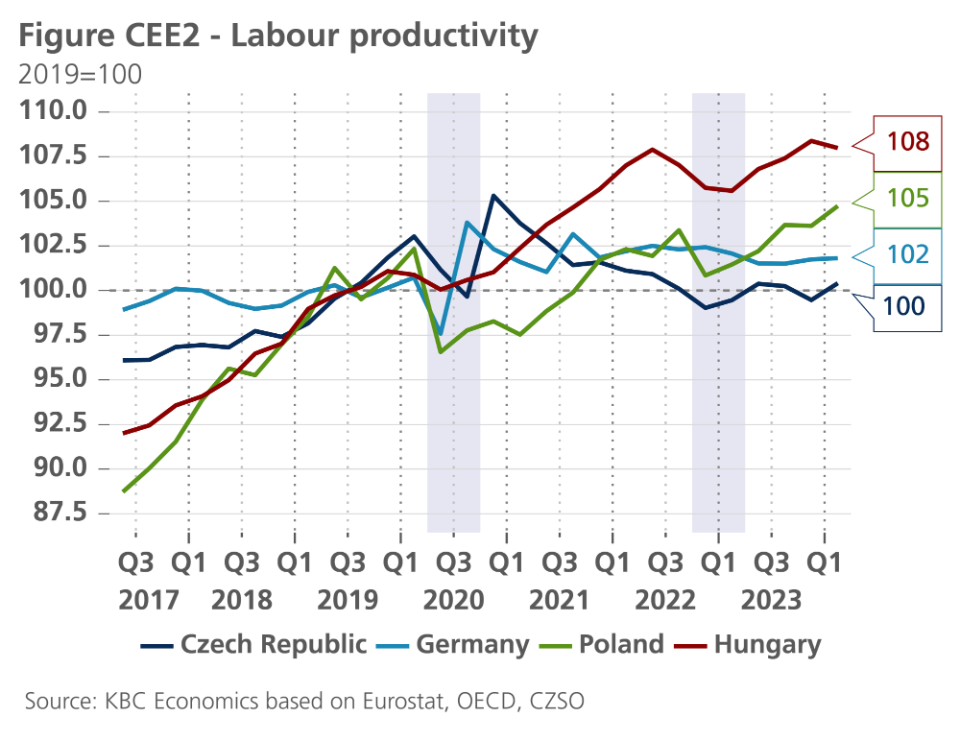
Nevertheless, in the longer run, real productivity growth is the most important driver of real wage and consumption growth (see figure CEE 2). In that respect mainly the Czech Republic has been lagging behind recently. Productivity is still at levels close to the 2019 average, while Polish and Hungarian productivity has clearly outperformed. On the other hand, the Czech situation looks much better if we focus only on the productivity in export-oriented manufacturing. The main factor that has contributed to the deterioration of overall productivity in the Czech Republic seems to be the domestic-oriented service sector, which was hit more significantly by the reduction in real spending and increase in excessive savings. Taking that into account, the normalisation of the savings ratio could contribute to the rebound in Czech productivity in the quarters ahead and some catch up with regional peers.

Economic forecasts June 2024

Czech Republic

            2023 2024 2025
Real GDP  (average yearly change, in %) -0.2 1.4 2.9
Inflation (average yearly change, harmonised CPI, in %) 12.1 2.5 2.6
Unemployment rate (Eurostat definition, in % of the labour force, end of year) 2.7 3.3 3.2
Government budget balance (in % of GDP) -3.7 -2.5 -1.7
Gross public debt (in % of GDP) 44.0 44.3 43.5
Current account balance (in % of GDP) 0.4 0.9 1.0
House prices (Eurostat definition, average yearly change in %, existing and new dwellings) -1.7 2.3 3.8
            18/6/2024

Slovakia

            2023 2024 2025
Real GDP  (average yearly change, in %) 1.6 2.6 2.6
Inflation (average yearly change, harmonised CPI, in %) 11.0 2.7 4.1
Unemployment rate (Eurostat definition, in % of the labour force, end of year) 5.6 5.6 5.5
Government budget balance (in % of GDP) -4.9 -5.8 -5.2
Gross public debt (in % of GDP) 56.0 58.2 59.2
Current account balance (in % of GDP) -1.6 -2.8 -2.8
House prices (Eurostat definition, average yearly change in %, existing and new dwellings) 0.1 1.5 3.0
            18/6/2024

Hungary

            2023 2024 2025
Real GDP  (average yearly change, in %) -0.7 2.4 3.6
Inflation (average yearly change, harmonised CPI, in %) 17.0 3.7 4.2
Unemployment rate (Eurostat definition, in % of the labour force, end of year) 4.2 3.9 3.6
Government budget balance (in % of GDP) -6.7 -5.2 -3.9
Gross public debt (in % of GDP) 73.5 73.4 72.6
Current account balance (in % of GDP) 0.3 1.0 0.6
House prices (Eurostat definition, average yearly change in %, existing and new dwellings) 5.6 4.0 4.5
            18/6/2024

Bulgaria

            2023 2024 2025
Real GDP  (average yearly change, in %) 2.0 2.3 3.0
Inflation (average yearly change, harmonised CPI, in %) 8.6 3.6 3.0
Unemployment rate (Eurostat definition, in % of the labour force, end of year) 4.4 4.2 4.0
Government budget balance (in % of GDP) -1.9 -2.8 -2.8
Gross public debt (in % of GDP) 23.1 23.4 25.1
Current account balance (in % of GDP) -0.2 -0.6 -0.5
House prices (Eurostat definition, average yearly change in %, existing and new dwellings) 9.9 2.6 3.0
            18/6/2024

Other forecasts and economic updates

World

Belgium

Ireland