Economic Perspectives for Belgium
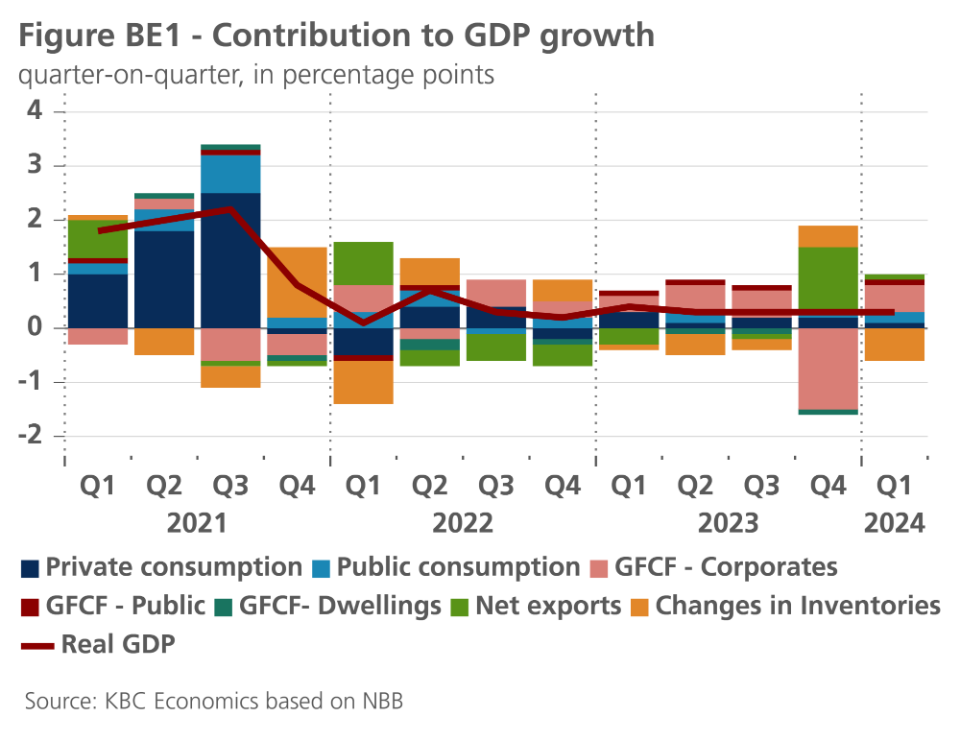
The earlier flash estimate of Q1 2024 GDP growth was confirmed at 0.3% by the National Accounts Institute. Belgian qoq growth has been remarkably stable at (close to) that pace since Q3 2022. Looking at the details, growth in the first quarter was supported by all components of final domestic demand and by net exports, but was hit by a substantial negative contribution of inventories (see figure BE1). Household consumption continued to be a growth driver, although its rise (+0.2%) was less than in previous quarters. Surprisingly, households’ residential investment rose by 0.8%, reversing the downward trend of the previous quarters. Government consumption and investment increased by 0.7% and 3.3%, respectively. Business investment grew by a strong 3.1%. Exports and imports both contracted, by 0.3% and 0.4% respectively, resulting in a slight positive growth contribution of net exports. Corporate investment and exports statistics were still strongly affected by the exceptional ships sale abroad in Q4 2023. After correction for the sale, investment growth turned out moderately positive in Q1, while the growth contribution of net exports was more clearly positive.
Steady growth pace
Indicators point to real GDP likely continuing to grow at roughly the same pace in the coming quarters. Consumer confidence continued to weaken slightly in May, but still is close to its long-term average. With household income expanding more slowly compared to 2023, consumption growth is expected to moderate going forward. Business confidence, on the other hand, recorded a minor improvement in May, compensating the decline seen in the previous month. Most striking is the significant improvement of (export) order-books in the manufacturing industry. As the loss in cost competitiveness, accumulated in 2022-2023, is likely to decrease, growth in exports is expected to improve in the coming quarters. All in all, we see domestic demand becoming less supportive for GDP growth in 2024 and 2025, while net trade no longer drags down GDP growth. On balance, with qoq growth steady at around 0.3%, the Belgian economy is expected to grow by 1.2% in both 2024 and 2025, unchanged from previous month’s forecast.
After nearly having come to a standstill in Q4 of last year, employment strengthened again in the first quarter of 2024 (see figure BE2).
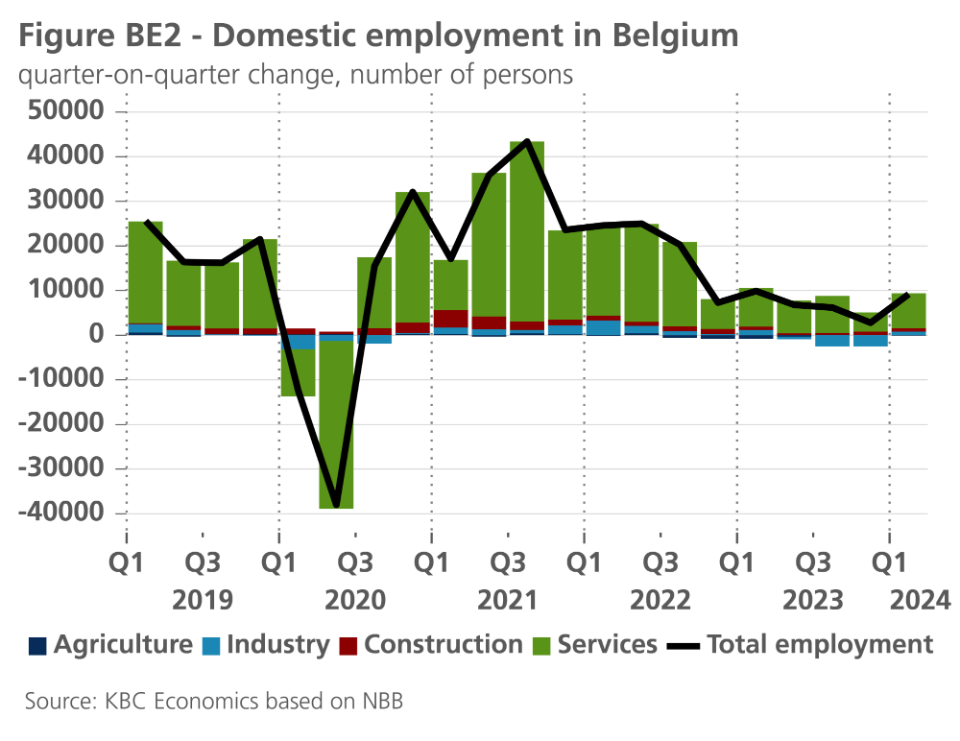
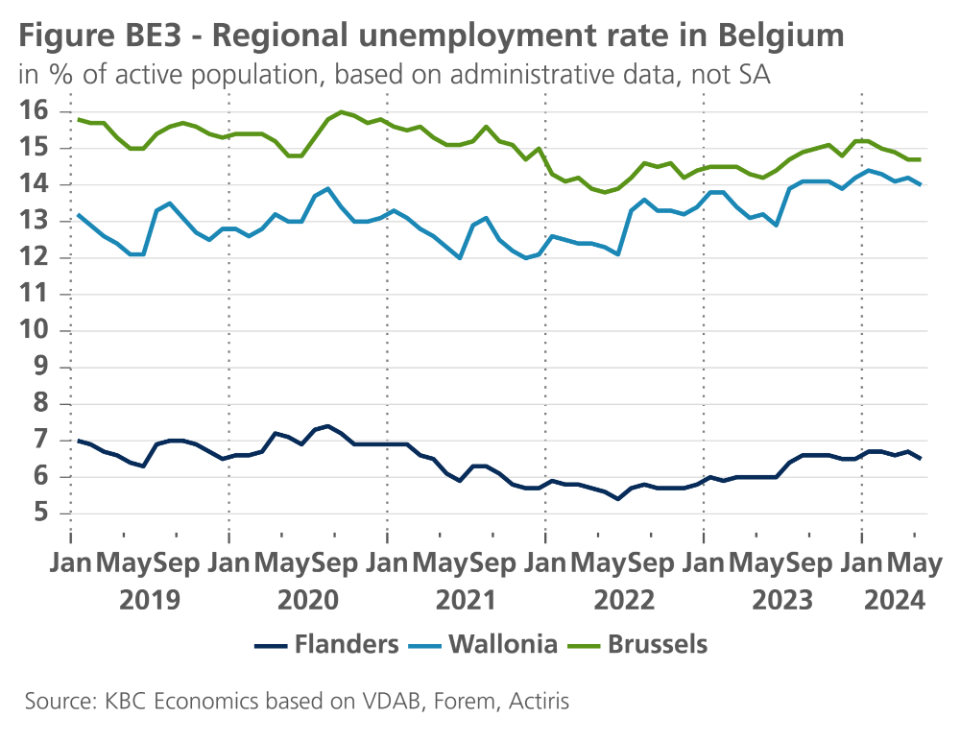
9,200 net jobs were created on a quarterly basis, against only 2,800 in Q4. Job creation turned positive again in the manufacturing sector, following three negative quarters. Also, according to the NBB’s business barometer, employment expectations have bottomed out in the manufacturing and construction sectors. In contrast, the unemployment rate data for the first three months of 2024 were revised slightly upward by Eurostat. In April, the rate stood at 5.8%. The harmonised unemployment series is now showing a slightly upward trend since summer 2023, which is also visible in each of the three regions based on administrative data (see figure BE3). Despite this, we expect Belgium’s labour market to remain resilient, with the unemployment rate staying at a low level below 6% and some 0.5% net jobs being added in both 2024 and 2025.
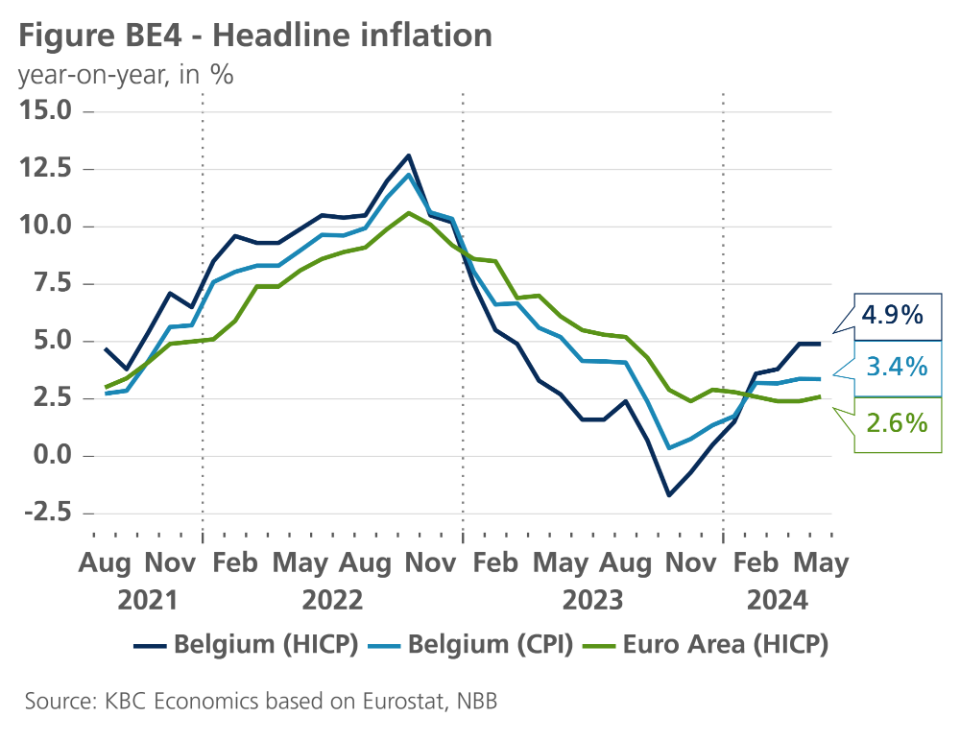
Core inflation gap with euro area narrows
Our inflation outlook stays at 3.8% for 2024, while the figure for 2025 was revised slightly upward to 2.2%, from 2.1%. In May, Belgian headline inflation (HICP definition) was stable at 4.9%. Core inflation (i.e., excluding energy and food) fell again, though, from 3.4% to 3.1%. Services inflation, which has been sticky and well above the euro area figure during the past year, decreased even sharply, from 4.7% to 4.1%. As services inflation in the euro area increased in May (from 3.7% to 4.1%), the gap with the euro area was closed. For core inflation as a whole (including goods and services), the gap with the euro area narrowed to 0.2 percentage points only. Although also narrowing a bit , the gap for headline inflation is still much wider at 2.3 percentage points. Moreover, HICP inflation in May (4.9%) was still well above national CPI-based inflation (3.4%), due to differences in the relative weights of the inflation components as well as other methodological differences (see figure BE4).