

Investment in sustainable government bonds: developed markets
Sustainability of developed markets: 2020 update


Abstract
KBC takes a wide range of sustainability indicators into account when screening countries for its SRI (socially responsible investment) bond funds. In this research report we give an overview of the screening methodology, as well as the results of the latest update (made end-2020) for the group of developed countries. The Scandinavian countries and Switzerland continue to occupy the first five places in the country ranking (otherwise known as the 'KBC Sustainability Barometer for Developed Markets'). Japan, Estonia and South Korea move up the most in the ranking, while Spain, Malta and Israel have lost several places. Belgium continues to rank 14th out of 44 countries considered. In consultation with the SRI Advisory Board, it has been decided to exclude countries from the investment universe that, although belonging to the group of 50% best scoring countries in the general screening, are among the 10% worst performers for one of the five themes considered in the sustainability barometer. Canada scores among the worst performers (41st place in the ranking) for the theme 'Environmental performance and commitment' and will therefore be excluded.
Sustainability forms an integral part of the KBC group’s general business strategy. The socially responsible investment (SRI) funds offered by KBC Asset Management form an important element of this. Since 2000, sustainable investing worldwide has become increasingly focused on bonds alongside equity. According to the European Sustainable Investment Forum (Eurosif), bonds accounted for 40% of the total SRI capital invested in Europe in 2018, compared to 47% for equity (Eurosif, 2018). Of this figure, 57% was invested in corporate bonds, 33% in government bonds (‘sovereigns’) and 10% in bonds issued by local governments or international institutions like the European Investment Bank and the World Bank.
Sustainable investment in government bonds requires additional analysis, just as it does with equities and corporate bonds. This amounts to ‘country screening’ or, more specifically, analysis of the importance that national governments attach to sustainability and social responsibility in their policies. We begin this research report by sketching out what ‘sustainability of countries’ entails. We then look at the way in which countries can be analysed for sustainability. In doing so, we examine in detail the yardstick that KBC has developed for its SRI bond funds. We also focus specifically on the (limited) adjustments we made to the screening methodology in the most recent update. Finally, we discuss the results of our most recent calculations (the 2020 update of the ‘KBC Sustainability Barometer’), as well as developments since 2002, when we performed the analysis for the first time. The screening analysis in this report only relates to the developed markets group. The emerging markets group is discussed in a separate report1.
Definition
Sustainability analyses for countries and their application in the investment field are even less common than those for businesses. This is because there is no universal description of what the ‘sustainability of countries’ precisely encompasses, which in turn reflects the fact that the objectives and tasks of governments are more multifaceted than those of businesses. Government policy is focused overall on the sustainable promotion of general well-being – the well-being of as many citizens as possible. This is determined by a whole range of factors: material prosperity, health, personal development, justice, equal opportunities, liberties, absence of social and political tensions, security and so on. It is equally important that this well-being is not achieved at the expense of future generations, citizens of other countries or animal welfare. Consequently, aspects such as environmental sustainability, international peace and commitment to developing countries have to be taken into account explicitly.
Viewed in these terms, the sustainability of countries may be defined as ‘the totality of actions, institutions and policy interventions in a country that promote the well-being of its current and future population in a sustainable manner, without jeopardising the environment or the well-being of the population of other countries’2. However, fleshing out this definition in practice is subjective and not straightforward. In addition to the many relevant factors, subjectivity arises from conflicting views on the extent to which the government should intervene to achieve this sustainability. Opinions can range from a strong preference for far-reaching governmental correction of the potential excesses of profit maximisation by corporations (social exploitation, environmental neglect, etc.) to the opinion that at the end of the day free-market principles continue to offer the best guarantee of sustainable prosperity and progress (greater likelihood of personal initiative, full employment, etc.).
Added value
When investing in government bonds, reference is usually made to the opinion of credit rating agencies – independent private companies that rate the creditworthiness of institutions issuing debt. These agencies use risk models to assess the likelihood that the issuers in question – companies and banks as well as governments – will be unable to repay their debts. They rate issuers’ creditworthiness using letter combinations ranging from AAA (triple A), the very best score, to D, the worst, with a whole range of intermediate ratings. All ratings above a particular level are viewed as high-quality or ‘investment-grade’ bonds. Lower ratings indicate riskier debt (speculative grade or ‘junk’). The ratings provide professional investors or credit providers like banks, insurers and pension funds with a benchmark for the financial health of governments and businesses, which supplements their own risk models. This helps them gauge risk when purchasing debt issued by these bodies and hence to compile portfolios with the desired risk profile. The level of the rating thus serves as a guideline for the risk premium to be incorporated in calculating the return on debt. Ratings are important to issuers in terms of the level of the interest they have to pay on their debt instruments and, consequently, are often decisive for their financing structure. Rating agencies therefore play a coordinating role in the financial markets: they bridge the information gap between issuers and investors.
The credit rating agencies have traditionally based their ratings solely on purely economic risks such as the issuer’s solvency and liquidity. In the case of countries, this means looking at variables that indicate their economic stability. The most important of these are long-term growth potential, the balance of payments position and competitiveness, external debt, government borrowing and political stability. Rating countries by sustainability offers a useful supplement to traditional financial analysis, as it does in the case of businesses. A country that invests in the sustainable promotion of its citizens’ general well-being is, after all, laying the foundation for favourable and stable economic and political development in the future. Such investment stimulates the accumulation and quality of the labour and capital factors3.
From a theoretical perspective, there is also a drawback to using country sustainability analysis. When determining the composition of their portfolios, asset managers consider not only expected return, but also risk. That is why they aim for a broad diversification of their investments. However, sustainability criteria impose additional, non-financial constraints on their investment decisions. This limits their opportunities for diversification and, all other things being equal, increases the risk of investment portfolios. The relative performance of conventional versus sustainable investments in terms of risk and return is ultimately an empirical question. Studies clearly show that sustainable investment products do not perform markedly better or worse in practice than traditional investments when taking both risk and return into account. This also applies specifically to investment in sustainable bonds4. Furthermore, investors who opt for SRI are often motivated by a fundamental choice to strive for social added value in addition to the hoped-for financial return. Apart from the performance of the investment, the added value of the sustainability analysis of countries therefore also consists of the extra, non-financial dimension offered to investors.
Screening methodology
Numerous yardsticks have been developed in recent decades to combine various sustainability factors into a single index. Some of these focus on just one aspect, such as Yale University’s Environmental Performance Index or Transparency International’s Corruption Perceptions Index. Broader measures primarily attempt to achieve a better indication of social well-being than traditional per capita GDP. Some of these, such as the United Nations’ Human Development Index, have become well known. Most alternative measures of well-being continue to correlate closely with per capita GDP. This is not the case with benchmarks that take substantial account of ecological aspects, like the Sustainable Society Foundation’s Sustainable Society Index or the New Economics Foundation’s Happy Planet Index, in which case the correlation is more likely to be negative5. This is because countries with a high level of material prosperity pay a price for it in terms of environmental pollution or depletion of natural resources.
The above-mentioned indices provide an incomplete picture of what is meant by the sustainability of countries. It was for this reason that KBC decided to develop its own benchmark for its sustainable bond investments, which would approach the matter from as broad an angle as possible. KBC Asset Management (the KBC Group’s fund manager) first calculated its ‘Sustainability Barometer’ for countries back in 2002, to serve as the basis for investment choices in its SRI funds. The box on page 4 contains an overview of KBC’s SRI bond funds. The scoring model generates a country ranking which leads to a decision on which government bonds may be included in the sustainable investment universe. The model uses a database that is updated annually with newly available information for the different indicators. The methodology was developed in consultation with the macroeconomists in KBC’s research department. It is a dynamic model that can be adjusted when necessary to take account of new sustainability trends. KBC is advised on the various sustainability aspects by a panel of independent experts (the SRI Advisory Board).
Box 1 - KBC's SRI bond funds
KBC has long been active in the field of sustainable or socially responsible investment. In 1992, the KBC Eco Fund was launched as the first Belgian investment fund to invest in shares of companies active in the environmental sector. The first sustainable bond fund was launched on the Belgian market at the beginning of 2002, also by KBC: the KBC Institutional Fund Ethical Euro Bonds, a sub-fund of KBC Institutional Fund focused on investments in bonds denominated in euros. Since then, KBC's range of sustainable investment funds has expanded considerably, both for private and institutional clients. In 2018, Pricos SRI, the first sustainable pension savings fund on the Belgian market, was added to the range.Today, KBC's range of SRI products consists of more than 50 funds. The total assets under management in these funds amounted to more than 15 billion euros at the end of September 2020. The bond funds make up about a quarter of this. Part of these funds invest exclusively in corporate bonds. For the choice of companies, the fund managers of KBC Asset Management use the sustainability analysis of companies. For funds investing in government bonds, the fund managers use the results of the scoring model discussed in this report. This is the case, for example, in the total solutions approach for clients, such as the ExpertEase SRI funds.
The KBC approach
The rating model
The KBC model includes five themes: (1) General economic performance and stability; (2) Socio-economic development of all citizens; (3) Equality, freedom and rights of all citizens; (4) Environmental performance and commitment; and (5) Peace, security and international relations. Each theme is sub-divided in turn into three sub-indicators (see below). By considering a broad range of sustainability factors, we aim to avoid any tendency towards extremes. The selection of the sub-indicators was based, to as great an extent as possible, on composite indicators, which take account of a multiplicity of information from as broad an angle as possible. All the figures are drawn from international institutions (OECD, the United Nations and the World Bank) or from prominent organisations like the World Economic Forum. In addition to the guaranteed quality of the underlying research, this offers the benefit of consistent availability and ease of international comparison between many countries. The model examines the OECD countries, plus member and candidate member states of the European Union (EU), which do not belong to the OECD – in principle a total of 45 countries. We impose a further requirement, however, that in order to be included in the calculation of the sustainability barometer, data must be available for at least 80% of the 15 sub-indicators taken into consideration. Applying this rule meant that we excluded two countries (Albania and Montenegro) in the 2020 screening exercise, leaving a total of 43 countries in the sustainability analyses. In the screening for 2019 we increased the group to 44 countries. Singapore was added, though it does not meet the above criteria to be included in the screening exercise for developed countries. In consultation with the SRI Advisory Board it was decided that, given its very high level of prosperity in terms of GDP per capita, the country belongs more to the group of developed countries than to the emerging markets. Singapore is therefore no longer included in KBC's screening exercise for emerging markets.
The final country rankings are calculated in two stages. The first step is to standardise the original indicator values, to allow the scores for the different sub-indicators to be compared. This means that, for each indicator, the raw country scores are converted to a score of between zero and one. The country with the worst performance always has a score of zero and the country with the best performance has a score of one. If a country does not have a score for one indicator, it is not included in the standardisation. Standardisation is therefore based on one of the following formulas, depending on whether a high indicator score indicates a better or poorer performance:
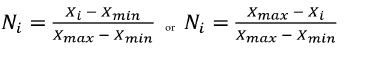
the country with the lowest indicator value; and Xmax = the raw indicator value of the country with the highest indicator value.
In the second stage, we calculate the weighted average sum of the standardised indicator scores for each country:
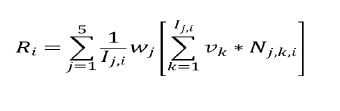
the weighting for theme j (j = 1 to 5); and vk = the weighting for sub-indicator k (k = 1 to Ij,i). We have opted to give the five main themes an equal weighting in the calculation. Each of the sub-indicators also has equal weighting within each theme. I.e. wj = 20% and vk = 33.3%. The choice of equal weightings means that the calculation boils down to the arithmetic mean.
The bonds of the best-performing 50% of countries may be considered for inclusion in the SRI universe (best-in-class approach). Since we take account of 44 countries in the screening exercise, the 50% cut-off point is below the 22nd country in the ranking. We also apply a ‘waiting room principle’, to avoid a situation in which countries that might ‘leap-frog’ the cut-off point from year to year aren’t constantly entering and exiting the investment universe: i.e. countries that fluctuate around the cut-off point, but remain within a range of two countries above or below it, do not immediately have an impact on the investment universe. It is only when the new position above or below the cut-off point is confirmed by a subsequent screening that we adjust the universe accordingly. All other movements over the cut-off point, by contrast, have an immediate impact on the investment universe.
The themes and sub-indicators
The five main themes and their sub-indicators taken into account in the model are sketched out below, including a rough description and an explanation of their significance. A complete, more detailed breakdown of the themes, the sub-indicators and the various aspects within them, can be found in the appendix to this report.
Theme 1 – General economic performance and stability
Good and stable macroeconomic performance is the bedrock of a society’s prosperity. Specifically, this means a satisfactory and stable economic growth rate and the absence of imbalances (sub-indicator 1.1). The latter implies the fullest possible utilisation of the labour force (low unemployment), the retention of monetary value (low inflation) and balance-of-payments and public-sector-budget equilibrium. The model measures average real GDP growth over the most recent five years as well as its volatility over that period. Regarding imbalances, we calculate the sum of the unemployment rate, inflation, the deficit on the balance-of-payments current account (as a percentage of GDP) and the public-sector deficit (as a percentage of GDP). Once again, the five-year average is taken into account.
In addition to the current economic situation, we consider the future economic potential (sub-indicator 1.2) and the quality of institutions (sub-indicator 1.3). The first of these relates to the adoption of new technology and research and development efforts, while the second concerns institutions crucial to supporting market-oriented economic activity, such as the protection of ownership rights, the independence of the legal system and effectiveness of government spending. We use the World Economic Forum’s Global Competitiveness Index to this end, more specifically the sub-indices ‘ICT adoption’, 'innovation capability’ and ‘institutions’.
Theme 2 – Socio-economic development of all citizens
In addition to economic performance and stability, governments focus on the socio-economic development of their citizens. The first indicator we consider in this regard is comprised of traditional development benchmarks: per capita GDP, poverty levels and life expectancy (sub-indicator 2.1). A second indicator measures achievements and policy efforts concerning citizens’ education and employment (sub-indicator 2.2). This is based on the participation in, and the level of education (the ‘education and training’ sub-index of the World Economic Forum’s Global Competitiveness Index) and the workforce participation rate (number of working people as percentage of the population aged 15+).
The second theme also embraces the situation and policy efforts in public health (sub-indicator 2.3). This indicator uses World Health Organisation figures on the number of people employed in the healthcare sector (doctors, dentists, pharmacists and nurses; per 100,000 inhabitants) and government spending on healthcare (as a percentage of GDP).
Theme 3 – Equality, freedom and rights of all citizens
It is the task of government to limit inequality between citizens, but also to provide them with liberties and rights to enable their personal development and their ability to take initiatives. Inequality between citizens is measured by income inequality, specifically using the GINI coefficient (sub-indicator 3.1). In the case of political rights and civil liberties, we draw on the World Bank’s Governance indicators, specifically that for ‘voice and accountability’ (sub-indicator 3.2). This brings together all traditional rights and liberties (freedom of speech, religion, press, travel, etc.). Specific attention is paid to the freedom and ease of carrying out an economic activity (sub-indicator 3.3). This is measured by the ‘ease of doing business’ index of the World Bank’s ‘Doing Business Report’.
Theme 4 – Environmental performance and commitment
The model also takes account of progress in environmental quality (air, water, biodiversity, etc.) and reducing pressure on the environment (waste reduction, combating the depletion of raw materials, etc.). We focus on three aspects within this fourth theme: environmental performance, ecological footprint and climate change. The first of these is measured by the Environmental Performance Index published by the universities of Yale and Colombia (sub-indicator 4.1). This is made up of benchmarks for environmental pollution, biodiversity, forest management, overfishing, etc. The second aspect is measured using the Ecological Footprint score from the Living Planet Report published by the World Wide Fund for Nature (WWF) (sub-indicator 4.2). This figure indicates how large an area of biologically productive land and water a population group requires in one year to maintain its level of consumption and process its waste production. We measure climate-change aspects using the Climate Change Performance Index published by Germanwatch and the Climate Action Network Europe (sub-indicator 4.3). This index compares the progress made in terms of climate protection by countries that are responsible for 90% of carbon emissions.
Theme 5 – Security, peace and international relations
The final theme focuses on the existence and achievement of peace and security, and on international relations between countries. Peace and security are amongst citizens’ most important basic needs and are simultaneously essential preconditions for economic prosperity. To measure them, we use Vision of Humanity’s Global Peace Index (sub-indicator 5.1), which maps existing conflicts and measures insecurity based on, for example, the number of murders and assaults, and how easy it is to purchase weapons.
There are two dimensions to measuring international relations between countries. The first concerns the degree to which countries have open borders and are signatories to international treaties (sub-indicator 5.2). We measure the first of these using the KOF Institute’s Index of Globalisation, which takes account of economic, social and political globalisation. The second is measured with reference to the status of ratification of important international treaties (primarily those relating to fundamental human and employment rights). The second dimension of international relations concerns the degree to which countries have committed to development aid, which we measure using the Centre for Global Development’s Commitment to Development Index (sub-indicator 5.3).
Screening results
KBC Sustainability Barometer: update 2020
Denmark, Sweden and Norway occupy the first three places respectively in the general country ranking of the KBC Sustainability Barometer (see table 1). Switzerland and Finland also score very well, taking the fourth and fifth place respectively. The Scandinavian countries and Switzerland convincingly demonstrate that economic, social and ecological performance and policy goals need not conflict with each other, but can, on the contrary, reinforce one another. These countries have been at the top of the country ranking since the start of KBC's screening exercise in 2002 (see also further on).
For the most part, year-on-year changes in the rankings are limited. Such changes mainly consist of shifting one or two positions, which are of little significance since the scores of successive countries are frequently very close to one another (i.e. the ‘leapfrog’ phenomenon). Still, there were also some larger shifts compared to the previous ranking in 2019. There were notable drops on the part of Spain (-3 places), Malta (-5 places) and Israel (-7 places). Striking improvements in the ranking come from Japan (+3 places), Estonia and South Korea (both +4 places). The Central and Eastern European countries deserve special mention as almost all of them are making progress in the rankings (Latvia and Bulgaria are the only exceptions).
Belgium's position in the sustainability barometer remained stable this time, ranking 14th in the group of 44 countries. The country scores best (7th place) for the 'security, peace and international relations' theme. It scores worst (a meagre 29th place) for the 'environmental performance and commitment' theme. More detail on Belgium's performance in the country ranking can be found in a KBC Economic Opinion published together with this Research Report7.
Changes to investment universe
The bonds of the best-performing 50% of countries may be considered for inclusion in the SRI universe (best-in-class approach). Furthermore, KBC applies an additional exclusion criterion based on a list compiled each year of ‘controversial regimes’. This list considers data for 197 countries concerning political rights and civil liberties as provided by Freedom House and the World Bank’s Worldwide Governance Indicators. KBC excludes the 15 most controversial countries from all investment funds. KBC goes a step further for the sustainable government bonds funds: any country that appears in the top half of the controversial regimes list is excluded from KBC SRI government bonds funds, regardless of their ranking in the Sustainability Barometer.
Since the screening exercise takes into account 44 countries, the 50% cut-off point is below the 22nd country (i.e. the Czech Republic). In the previous screening end 2019, Spain increased above the 50% cut-off point but was within the waiting room (i.e. the band of two countries above and two countries below the cut-off point), so it did not end up in the investment universe yet (see decision principles above). In the 2020 update, the country again fell below the 50% cut-off point and hence the consideration for inclusion in the investment universe is no longer an issue. The Czech Republic rises above the 50% cut-off point but is within the waiting room. Its positioning above the cut-off point therefore requires confirmation in the next screening in end-2021 before the country can be included in the investment universe.
It is possible for a country to score above the 50% cut-off point, and thus in principle to be included in the investment universe, but to score extremely badly on one of the five themes. Such an extremely poor score, even on just one theme, is not in line with the desire to only include the most sustainable countries in KBC's sustainable investment funds. That is why it was decided, in consultation with the SRI Advisory Board (the independent advisory board of experts that assists KBC with various sustainability issues), to exclude countries from the investment universe that have an overall score above the 50% cut-off point but belong to the 10% worst scoring countries for one (or more) of the five themes. In the latest update of the sustainability barometer, there is one country, Canada, that belongs to the 10% worst scoring countries (41st place out of a total of 44 countries) for theme 4 ('Environmental performance and commitment'). It was therefore decided to exclude the country from the investment universe despite its position (19th place) above the 50% cut-off point in the overall country ranking.

KBC first calculated its sustainability barometer for developed markets in 2002. This long history means we can track how countries have moved between successive annual ranking updates since then (see Figure 1). Please note that there is a break in the historical data – in the year 2008, when the rating model was significantly adapted and extended. Consequently, the calculations from before and after 2008 are not perfectly comparable with one another. The model was also adjusted during the 2018 update, albeit only to a limited extent. This model adjustment only had a limited impact on comparability with previous screening exercises. The additional countries taken into account in the 2018 and 2019 screening exercises are not included in the graphs so as not to hinder comparison with previous years.
The first striking finding is that the Scandinavian countries, together with Switzerland, have occupied the top places in the country ranking throughout the period (see the first panel in Figure 1). Although there have been many shifts from year to year, these often reflect the fact that the countries in question score very close to one another, with the result that there is a lot of leapfrogging in the rankings. In the case of the other countries, the scores tend to be somewhat further apart, with the result that shifts in their ranking over time have been less abrupt.
The second panel of Figure 1 shows changes in the position occupied by the world’s four major economic blocs (in the case of the euro area, we calculated the GDP-weighted average of member states’ rankings). For the most part, the relative positions have remained fairly stable, with Europe, and above all the United Kingdom, scoring persistently better than the United States and Japan. In the years leading up to 2016, Japan fell several places while the United States rose up the ranking. In 2016 the US temporarily moved ahead of Japan. The relative positions of the two countries were once again reversed, however, in the four most recent updates. In addition to Japan, the euro area and the United Kingdom rose in the rankings while the United States fell sharply. In the latest update (end of 2020), the euro area deteriorated slightly, while the other three economic blocs advanced somewhat.
Within the euro area, Greece has consistently ranked last. Countries that were hard hit on the socioeconomic front during the financial crisis from 2008 onwards had already slipped quite a few places in the rankings in the years prior to the crisis. In other words, the sustainability barometer proved to have a certain predictive power. The third panel of Figure 1 shows the peripheral countries of Portugal, Ireland, Greece and Spain, which experienced problems during the crisis. Of the four of them, Portugal suffered least, and its ranking remained the most stable. Ireland was the quickest to emerge economically from the financial crisis, which was also reflected in an improvement in its sustainability ranking over the period 2012–2016. In recent years, however, the country’s performance has once again declined, due primarily to a deterioration in the ‘environmental performance and commitment’ theme. Spain, by contrast, saw a clear improvement in its relative position since 2016, although its performance deteriorated somewhat in the latest update.
The fourth panel of Figure 1 compares Belgium’s performance with that of its three neighbours (the Netherlands, Germany and France). Throughout the period 2002–2020, Belgium has performed consistently worse in the sustainability barometer than Germany and the Netherlands. The position against France was alternately worse or better, but since 2017 the Belgian score has also been below that of France. Since 2015 Germany and France were able to make up previously lost ground. Germany, however, fell a remarkable two places again in the latest update of the sustainability barometer. The position of the Netherlands remained relatively stable over the entire period at a fairly high position.
Figure 1 - Evolution of country ranking in KBC sustainability barometer 2002-2020
Derwall, J. en K. Koedijk (2009), “Socially Responsible Fixed-Income Funds”, Journal of Business Finance and Accounting, 36 (1), p. 2010-229.
Drut, B. (2010), “Sovereign Bonds and Socially Responsible Investment”, Journal of Business Ethics, 92(1), p. 131-145.
Centre Emile Bernheim, Working Paper nr. 09/014.
Eurosif (2018), “European SRI Study 2018”, November.
KBC Economische Berichten (2014), “Duurzaam beleggen, de hype voorbij?”, nr. 20, 29 September 2014.
KBC Economische Berichten (2015), “Welzijn, meer dan ‘bruto binnenlands product”, nr. 26, 13 Februari 2015.
Leite, P. en M.C. Cortez (2016), “The Performance of European Responsible Fixed-Income Funds”.
Mellios, C. en E. Paget-Blanc (2006), “Which Factors Determine Sovereign Credit Ratings ?, European Journal of Finance, 12(4), p. 361-377.
North, D., Acemoglu, D., Fukuyama, F. en D. Rodrik (2008), “Governance, Growth, and Development Decision-making”, World Bank.
WCED (1987), “Report of the World Commission on Environment and Development. Our common future”, New York, United Nations.
Footnotes
1 See KBC Research Report, ‘Investment in Sustainable Government Bonds: Sustainability of Emerging Markets, update 2020" (26 January 2021)..
2 This definition is in line with the concept of sustainable development as first put forward by the Brundtland Commission (see WCED, 1987).
3 The link between sustainability aspects on the one hand and economic development and political stability on the other has been amply demonstrated in the literature. See, for example, Mellios & Paget-Blanc (2006) and North et al.
4 See KBC Economic Reports no. 20 (2014) for a list of the literature on the financial performance of SRI funds. For research on the performance of sustainable bonds, see Derwall & Koedijk (2009), Drut (2010) and Leite & Cortez (2016).
5 See KBC Economic Bulletin no. 26 (2015) for a survey and detailed analysis.
6 Care was taken when selecting the sub-indicators to avoid excessive correlation between them.
7 See KBC Economic Opinion "Belgium lags neighbours in sustainability", 27 January 2021.
Appendix: Detail thema's en deelindicatoren van de KBC-duurzaamheidsbarometer
Theme 1 - General economic performance and stability
Indicator 1.1: Macroeconomic Performance & Absence of Disequilibria (Source: own calculation based on IMF data)
- Real GDP growth (%, average of past 5 years) (25%)
- Volatility of economic growth (standard deviation of real GDP growth over past 5 years) (25%)
- Sum of inflation (%), unemployment rate (% of labour force), current account deficit (% of GDP) and government deficit (% of GDP) (average of past 5 years) (50%)
Indicator 1.2: Future Business Potential (Source: sub-index from Global Competitiveness Index, World Economic Forum)
ICT adoption (50%):
- Mobile-cellular telephone subscriptions
- Mobile-broadband subscriptions
- Fixed-broadband internet subscriptions
- Fibre internet subscriptions
- Internet users
Innovation capability (50%):
- Interaction/diversity (workforce diversity, state of cluster development, international co-inventions, multistakeholder collaboration)
- Research and development (scientific publications, patent applications, R&D expenditures, research instutions prominence)
- Commercialisation (buyer sophistication, trademark applications)
Indicator 1.3: Public and private institutions (Source: sub-index from Global Competitiveness Index, World Economic Forum)
- Security (organized crime, homicide rate, terrorism incidence, reliability of policy services)
- Social capital
- Checks and balances (budget transparency, judicial independence, freedom of the press,...)
- Public sector performance (burden of government regulation, efficiency of legal framework in setting disputes,...
- Transparency (incidence of corruption)
- Property rights (intellectual property protection, quality of land administration,...)
- Corporate governance (strength of auditing and accounting standards, shareholder governance,...)
- Future orientation of government (ensuring policy stability, long-term vision, renewable energy regulation,...)
Theme 2 - Socio-economic development of population
Indicator 2.1: Core Development Indicators (Source: World Bank; OECD)
- GDP per capita (33%)
- Poverty rate (population living below 50% of median income) (33%)
- Life expectancy at birth (number of years) (33%)
Indicator 2.2: Commitment to Education & Employment
Skills index (50%) (Source: sub-index from Global Competitiveness Index, World Economic Forum)
- Current workforce (school life expectancy)
- Skills of current workforce (extent of staff training, quality of vocational training, ease of finding skilled employees,...)
- Future workforce (school life expectancy)
- Skills of future workforce (critical thinking in teaching, pupil-teacher ration in primary education)
Employment rate (50%) (Source: World Development Indicators, World Bank)
- People employed as a % of people aged 15+
Indicator 2.3: Commitment to Health
Healthcare Workforce (50%) (Source: World Health Organisation)
- Number of healthcare workers (physicians, dentist, pharmacists, nurses) (per 100 000 population)
Healthcare Expenditures (50%) (Source: World Health Organisation)
- Public expenditures on health (% of GDP)
Theme 3 - Equality, freedom and rights of the population
Indicator 3.1: Prevalence of Inequality (Source: World Development Indicators, World Bank)
- GINI coefficient
Indicator 3.2: Voice, Political Rights and Civil Liberties (Source: sub-index Voice and Accountability from Governance Indicators, World Bank)
Measuring (perceptions of) the extent to which a country’s citizens are able to participate in selecting their government, as well as freedom of expression, freedom of association, and a free media:
- Civil liberties: Freedom of speech, of assembly and demonstration, of religion, equal opportunity, of excessive governmental intervention
- Political Rights: free and fair elections, representative legislative, free vote, political parties, no dominant group, respect for minorities
- Freedom of the Press
- Travel: domestic and foreign travel restrictions
- Imprisonments: Are there any imprisoned people because of their ethnicity, race, or their political, religious beliefs?
- Democratic Accountability. Quantifies how responsive government is to its people, on the basis that the less response there is the more likely is that the government will fall, peacefully or violently. It includes not only if free and fair elections are in place, but also how likely is the government to remain in power
- Representativeness: How well the population and organized interests can make their voices heard in the political system
Indicator 3.3: Ease of Doing Business (Source: index Doing Business, World Bank)
- Starting a business
- Dealing with construction permits
- Getting electricity
- Registering property
- Getting credit
- Protecting minority investors
- Paying taxes
- Trading across borders
- Enforcing contracts
- Resolving insolvency
Theme 4 - Environmental performance and commitment
Indicator 4.1: Environmental Performance Index (Source: Yale University & Colombia University in collaboration with World Economic Forum)
- Environmental burden of disease
- Water (effects on humans): adequate sanitation & drinking water
- Air pollution (effects on humans): indoor air pollution, urban particulates, local ozone
- Water (ecosystem vitality): water quality index, water stress
- Air pollution (ecosystem vitality): regional ozone, sulphur dioxide emissions
- Biodiversity & habitat: conservation risk index, effective conservation, critical habitat protection, marine protected areas
- Forestry: growing stock
- Fisheries: marine trophic index, trawling intensity
- Agriculture: irrigation stress, agricultural subsidies, intensive cropland, burnt land area, pesticide regulation
- Climate change: emissions/capita, emissions/electricity generated, industrial carbon intensity
Indicator 4.2: Ecological Footprint (Source: Living Planet Report, WWF)
- Extent of human demand on ecosystems (global hectares per person)
Indicator 4.3: Climate Change Performance Index (Source: Germanwatch & Climate Action Network Europe)
- Per-capita emissions trend in four sectors (energy, transport, residential, industry) (50%)
- Absolute, energy-related CO2 emissions (30%)
- Evaluation of the countries’ domestic as well as international climate policy (20%)
Theme 5 - Security, peace and international relationships
Indicator 5.1: Global Peace Index (source: Vision of Humanity)
Measures of Ongoing Domestic and International Conflict:
- Number of external and internal conflicts fought: 2001-06
- Estimated number of deaths from organised conflict (external)
- Number of deaths from organised conflict (internal)
- Level of organised conflict (internal)
- Relations with neighbouring countries
Measures of Societal Safety and Security:
- Number of displaced people as a percentage of the population
- Political instability
- Level of disrespect for human rights (Political Terror Scale)
- Potential for terrorist acts
- Number of homicides per 100,000 people
- Level of violent crime
- Likelihood of violent demonstrations
- Number of jailed population per 100,000 people
- Number of internal security officers and police per 100,000 people
Measures of Militarization:
- Military expenditure as a percentage of GDP
- Number of armed services personnel per 100,000 people
- Volume of transfers (imports) of major conventional weapons per 100,000 people
- Volume of transfers (exports) of major conventional weapons per 100,000 people
- UN Deployments 2007-08 (percentage of total armed forces)
- Non-UN Deployments 2007-08 (percentage of total armed forces)
- Aggregate number of heavy weapons per 100,000 people
- Ease of access to small arms and light weapons
- Military capability/sophistication
Indicator 5.2: Commitment to Development Index (Source: Centre for Global Development)
- The aid component moves beyond standard but narrow comparisons of the quantity of aid governments give, factoring in quality too. It penalizes donors for giving aid to rich or corrupt governments, for overburdening recipients with lots of small aid projects, or for “tying” aid, which forces recipients to spend it on the donor country’s own goods rather than shop around for the lowest price. The component also rewards tax deductions and credits that support private charity.
- The trade component penalizes countries for erecting barriers to imports of crops, clothing, and other goods from poor nations. It looks at two kinds of barriers: tariffs (taxes) on imports, and subsidies for domestic farmers, which stimulate overproduction and depress world prices. Such barriers deny people in poor countries jobs and income.
- The investment component compares rich countries on policies that encourage constructive investment in poor countries. It is based on a checklist of 22 questions: Do governments allow public pension funds to invest in poor countries? Do they offer insurance against political risks, such as expropriation, to encourage domestic companies to venture abroad? Do they first check for potential environmental and labour rights abuses in factories to be insured?
- The migration component compares rich countries on how easy they make it for people from poor ones to immigrate, find work or get education, send home money--and even return home with new skills and capital.
- The environment component compares rich countries on policies that affect shared global resources such as the atmosphere and oceans. Rich countries use these resources disproportionately while poor ones are less equipped to adapt to the consequences, such as global warming. Countries do well if their greenhouse gas emissions are falling, if their gas taxes are high, if they do not subsidize the fishing industry, and if they control imports of illegally cut tropical timber.
- The security component compares rich countries on military actions that affect developing countries. Rewarded are contributions to international peacekeeping and forcible humanitarian interventions that have an international mandate—unlike the invasion of Iraq but like the NATO intervention in Kosovo. Countries also get points for protecting sea lanes for global trade, but lose them for exporting weapons to authoritarian regimes with heavy military spending.
- The technology component analyses policies of the rich countries that support creation and dissemination of new technologies, which can profoundly shape life in developing countries. The component rewards government funding and tax breaks for R&D but penalizes certain patent and copyright rules deemed too restrictive to the flow of ideas across borders.
Indicator 5.3: Index of Globalisation (Source: KOF Institute; United Nations for International Treaties)
Measures of Economic Globalisation (data on flows and on restrictions; Source: sub-index from KOF-Index of Globalisation) (25%):
- Trade (% of GDP)
- Foreign direct investments (flows & stocks, % of GDP)
- Portfolio investment (% of GDP)
- Income payments to foreign nationals (% of GDP)
- Hidden import barriers
- Taxes on international trade (% of current revenue)
- Capital account restrictions
Measures of Social Globalisation (data on personal contact, information flows and cultural proximity; Source: sub-index from KOF-Index of Globalisation) (25%):
- Outgoing telephone traffic
- International tourism (% of total population)
- Foreign population (% of total population)
- International letters (per capita)
- Internet users (per 1000 people)
- Cable television (per 1000 people)
- Trade in newspapers (% of GDP)
- Radios (per 1000 people)
- Number of McDonald’s restaurants and Ikea (per capita)
- Trade in books (% of GDP)
Measures of Political Globalisation (Source: sub-index from KOF-Index of Globalisation) (25%):
- Number of embassies
- Membership of international organisations
- Participation in UN Security Council Missions
Ratification of International Treaties (Source: United Nations) (25%)
Status of Major International Human Rights Instruments:
- International convention on the prevention and punishment of the crime of genocide
- International convention on the elimination of all forms of racial discrimination
- International convenant on civil and political rights
- International convenant on economic, social and cultural rights
- Convention on the elimination of all forms of discrimination against women
- Convention against torture and other cruel, inhuman or degrading treatment or punishment
- Convention of the rights of the child
Status of Fundamental Labour Rights Conventions:
- Freedom of association and collective bargaining
- Elimination of forced and compulsory labour
- Elimination of discrimination in respect of employment and occupation
- Abolishment of child labour
Status of Major Environmental Treaties:
- Cartagena protocol on biodiversity
- Framework convention on climate change
- Kyoto protocol to the framework convention on climate change
- Convention on biological diversity
- Vienna Convention for the Protection of the Ozone Layer
- Montreal Protocol on Substances that deplete the Ozone Layer
- Stockholm Convention on Persistent Organic Pollutants
- Convention to Combat Desertification