

Economic Perspectives May 2024
Read the full publication below or click here to open the PDF.
- Easing tensions between Israel and Iran have paved the way for a decline in oil prices. Brent-prices eased to 86 USD per barrel at the end of April, well below the April peak of 90 USD. Higher global oil inventories also put downward pressure on prices. Gas prices (TTF), in contrast, rose 8% to 29 EUR per MWh due to reduced Norwegian gas flows and a late cold spell in the second half of April. They remain well-behaved, however, thanks to well-filled EU reserves (at 66% of total capacity).
- In the euro area, headline inflation stabilised at 2.4%, as year-on-year food and energy inflation increased. Core inflation, however, declined from 2.9% to 2.7%. Both goods and services inflation showed notable declines. Forward-looking indicators, such as producer prices and business expectations for prices, also point towards diminished pricing power and softer core inflation readings in the coming months. We thus lowered our 2024 forecast from 2.6% to 2.5%, while maintaining our 2.0% 2025 forecast.
- US inflationary pressure softened in April. Headline inflation slowed from 3.5% to 3.4%, while core inflation declined from 3.8% to 3.6%. Both core and headline monthly inflation stood at 0.3%, down from 0.4% last month. Food prices stagnated and core goods prices declined again. Meanwhile, services and shelter inflation also softened. Only energy prices made a big jump, partially compensating the slower inflation in other categories. We maintain our 3.3% and 2.5% inflation forecasts for 2024 and 2025, respectively.
- Softer core inflation readings provide an opportunity for central banks to start the rate cutting cycle. In the euro area, where core inflation is closer to the 2% target, we expect the ECB to start the rate cutting cycle in June and expect three rate cuts this year. In the US, where core inflation remains more persistent, we expect the rate cutting cycle to start in Q3 and expect only two rate cuts this year. However, given full data dependence and upside inflation risks, the timing of Fed easing remains uncertain. The June ECB rate cut seems more of a ‘done deal’.
- The euro area economy grew by a healthy 0.3% in Q1. Though southern economies still outperformed other member states, the German economy also grew by a decent 0.2%. The euro area labour market eased a bit, but remains overall tight. Confidence indicators are also improving overall, for both consumers and producers, especially thanks to improvements in the services sector. Manufacturing and construction activity indicators remained weak. We upgrade our 2024 forecast from 0.5% to 0.7%, while maintaining our 2025 forecast of 1.3%.
- The US economy grew by only 0.4% in Q1, well below consensus forecasts. The prime cause was a much lower contribution in net exports. Government spending and consumption also made smaller growth contributions. Other macroeconomic indicators also point to some softening. Employment numbers and confidence indicators came in lower than expected while productivity numbers also disappointed. Rising protectionism could hurt growth from next year onwards. We downgrade our 2024 growth forecast from 2.4% to 2.3% and our 2025 forecast from 2.0% to 1.8%.
- The Chinese economy continues to struggle on the domestic front and is facing new challenges to its external sector. A new support plan for the real estate sector may finally bring some relief to declining house prices and shore up confidence. However, new tariffs from the US and the threat of a larger trade war on the horizon complicate the outlook. For now, we continue to expect growth of 5.1% in 2024, before the economy slows to 4.0% growth in 2025.
The latest GDP figures for the major economies show there is light at the end of the tunnel. Following two quarters of negative growth, the euro area expanded by a healthy 0.3% last quarter. Even the hard-hit German economy grew by 0.2% in Q1. The Chinese economy also performed surprisingly well in Q1, growing at 1.6% quarter-on-quarter and 5.3% year-on-year, thanks to a major net export boost. This may make it easier for China to reach the CCP’s 5% growth target, but the surge in (net) exports also triggers protectionist reflexes from the US and the European Commission. The only major downside surprise was the US, where the economy ‘only’ expanded by 0.4%. Nonetheless, the fundamentals of the US economy remain healthy, especially in the labour market.
Core inflation figures also evolved positively for both the euro area and the US. This will likely allow the ECB to start cutting rates in June, while paving the way for the Fed to cut rates in September. However, as central banks remain fully data dependent, the timing of easing, especially for the Fed, remains uncertain and still hinges on upside or downside inflation surprises going forward.
Oil prices decline as US-Iran tensions ease
Oil prices were on a roller-coaster ride in April. Earlier in the month, Iran fired more than 300 missiles at Israel, in retaliation for an Israeli airstrike on an Iranian diplomatic compound in Syria. This pushed Brent oil prices above 90 USD per barrel. As the US pressured Israel not to escalate tensions, Israel retaliated with a rather symbolic strike on Iran. As tensions and risks of military escalation eased, oil prices declined to 86 USD at the end of April (2% lower than a month ago). Easing geopolitical tensions were not the only element pushing prices down, however. Global oil inventories also rose sharply in April, almost fully reversing the 59-million-barrel draw from inventories in Q1.
In contrast to oil prices, gas prices increased by 8% to 29 EUR per MWh by the end of April. The European continent experienced a late cold spell in April, which increased demand. Meanwhile, a leak in a Norwegian gas plant caused a drop in supply. End of April, Gas prices were 23% lower than a year ago, however as gas reserves are refilling quickly. EU gas reserves are filled at 66% of total capacity, around 20 percentage points higher than usual at this time of the year.
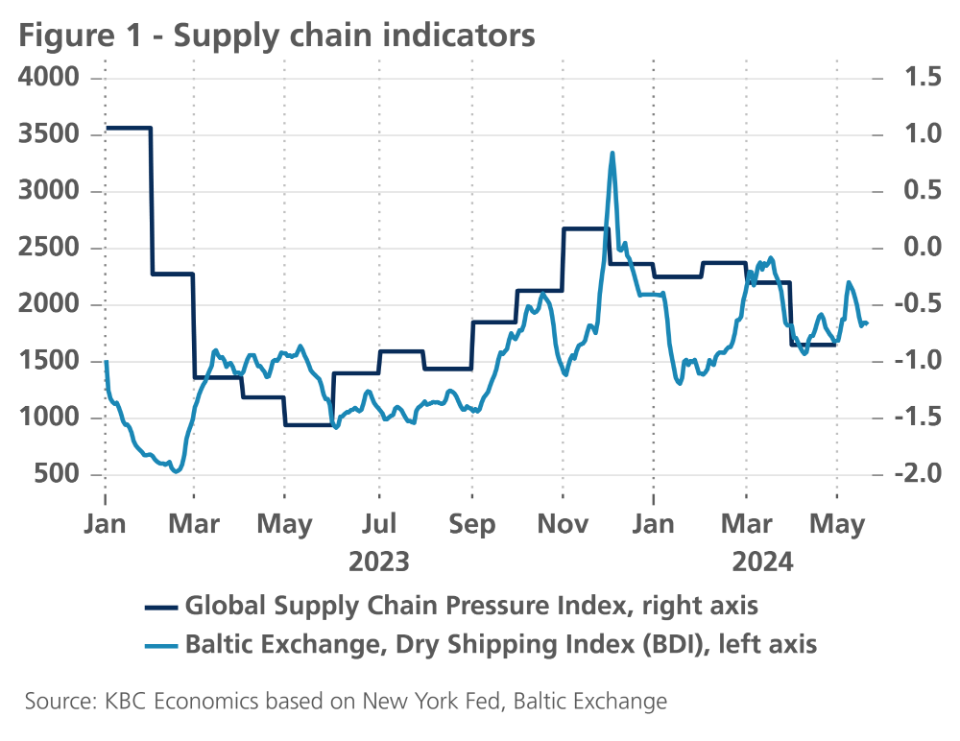
Global supply chains have also adapted well to tensions in the Middle East (figure 1). The Global Supply Chain Pressure Index declined markedly last month as supplier delivery times remain low despite rerouting due to military risks in the Red Sea.
Eurozone inflation stabilises
Eurozone inflation stabilised at 2.4% in April. Slightly higher food price inflation (2.8% in April versus 2.6% in March) and less negative energy price inflation (-0.6% versus -1.8%) neutralised a further decline in core inflation from 2.9% in March to 2.7% in April. Encouragingly, services inflation also eased to 3.7% after remaining stuck around 4% for five consecutive months. Importantly, the momentum in core inflation is slowing and is a welcome reversal from previously strengthening momentum. The mild increase in food prices has most likely been driven by short-term volatility effects. In any case, the most recent dynamics of producer food and beverage prices do not suggest an imminent and sustained acceleration of food price inflation.
In other words, the inflation outlook has not fundamentally changed. We continue to project a gradual further cooling of headline inflation. However, the recent oil price developments confirm that such cooling will follow a bumpy course. The surge in oil prices in international markets, which had prompted an upward revision of the inflation outlook last month, has since been reversed. Consequently, we have again lowered our expected average inflation rate for 2024 to 2.5% (instead of 2.6%). For 2025, we expect a further decline to an average of 2%, unchanged relative to last month.
US inflation eases in April
Following several months of upside surprises, April US inflation surprised slightly to the downside. Headline inflation declined from 3.5% to 3.4%, while core inflation declined from 3.8% to 3.6%. Month-on-month inflation dynamics also decelerated. Both headline and core inflation increased 0.3% in April (vs 0.4% in March).
Within non-core components, energy prices increased 1.1% last month, mostly as a result of higher gasoline prices. Food prices stayed flat over the month, as lower at home food prices compensated for higher restaurant prices.
Within core components, goods prices decreased for the second month in a row. Similarly, to last month, this decline was primarily caused by a decline in vehicle prices (new and used). However, the recent uptick in core goods producer prices suggests core goods consumer prices could rise again in coming months.
Shelter inflation also decelerated somewhat, thanks to lower hotel prices. Market rent prices (as observed by Zillow) also decelerated from 0.4% to 0.3%, indicating some softer shelter price inflation ahead.
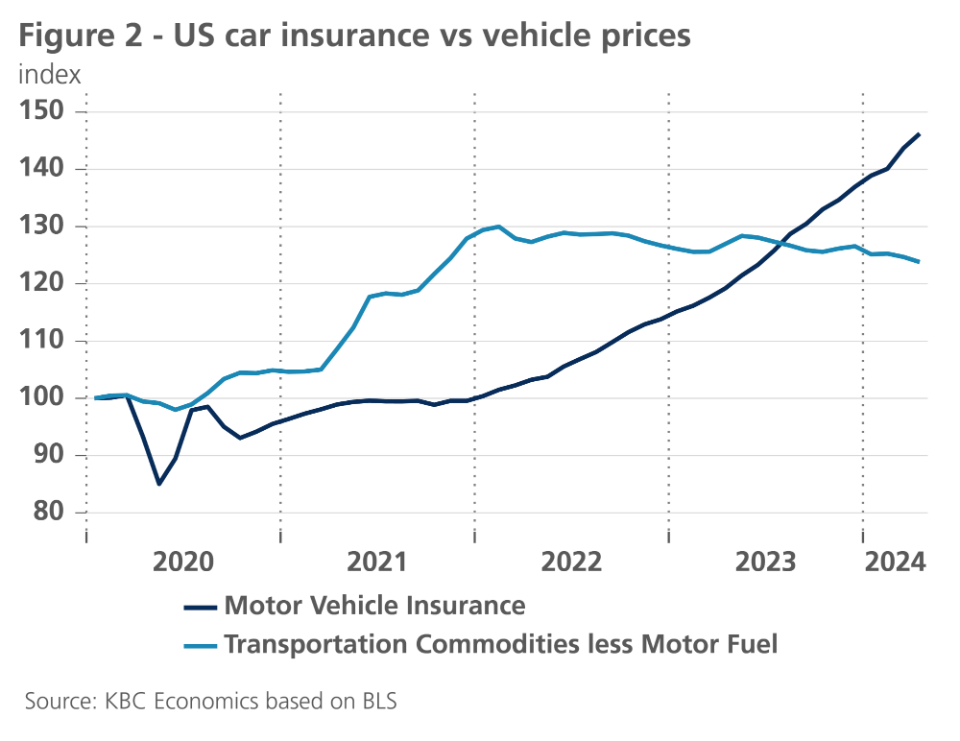
Another encouraging element in last month’s CPI report was the deceleration of core service price inflation (ex. shelter) from 0.7% to 0.5%. Transportation services were the most important contributor to core service inflation last month. Vehicle insurance in particular made a big jump. Insurance prices tend to follow prices of the insured assets with some lag. Current vehicle insurance prices thus have yet to incorporate the recent declines in vehicle prices that have been observed since 2022 (see figure 2).
Importantly, wage evolutions were also soft in April. Average hourly earnings rose only 0.2% last month (2.4% annualised). That said, the recent slowdown in productivity growth is a cause for concern. Given low productivity growth last quarter, unit labour costs grew by 1.2% last quarter (4.8% annualised). It remains to be seen whether this slowdown in productivity will persist (productivity numbers are very volatile).
Finally, consumers’ inflation expectations have unfortunately increased in May. According to the Michigan Survey, for the year ahead, consumers now expect inflation to reach 3.5% (up from 3.2%). Markets’ inflation expectations for the coming years, as priced in ILS contracts, by contrast remained broadly stable. All in all, we maintain our 3.3% and 2.5% inflation forecasts for 2024 and 2025 respectively.
ECB is preparing to kick-off the easing cycle
Against the backdrop of the continuing disinflationary trend of euro area core inflation, which further declined to 2.7% in April, and clear signaling by ECB policy makers, we confirm our view that the ECB will start the upcoming easing cycle by cutting its deposit rate by 25 basis points at its June meeting. For 2024 as whole, we expect three rate cuts of 25 basis points each, bringing the deposit rate to 3.25%. In our view, the ECB is likely to reach its terminal rate in this cycle at 2.50% by the end of 2025. These views are broadly in line with current market expectations.
Fed maintains rates while slowing the pace of its QT
The Fed is facing a stickier disinflationary path, but, in our view, recent weaker macroeconomic data still warrant two rate cuts by the Fed in 2024. The first one will probably happen in September. However, full data dependency leaves the timing of the start of the easing cycle still extremely uncertain. Moreover, in its May meeting, the Fed decided to slow the pace of the tapering of its securities portfolio built up during the QE period. Beginning in June, the Fed will not reinvest 25 bn dollars of maturing Treasury securities per month as opposed to the 60 bn dollars not reinvested previously. The monthly amount of mortgage backed securities (MBS) that will not be reinvested remains at 35 bn dollars. Any reinvestment of maturing MBS above that cap will be reinvested into Treasury securities.
The purpose of the Fed’s QT-operations is balance sheet normalisation, i.e. to run down its balance sheet towards its desired size. The equilibrium size of the Fed’s balance sheet, while significantly below its current size, is likely substantially larger than its pre-2008 level. From that perspective, QT and interest rate policy can be seen as two distinct policy actions. The announced slowing of the tapering pace is probably partly motivated by an increasing concern to avoid the risk of unforeseen liquidity shortages as excess liquidity evaporates. Nevertheless, the slowdown of the tapering pace amounts to a withdrawal of some policy tightening impulses, and hence implies a relative (mild) easing of the Fed’s policy stance.
Eurozone growth surprises positively
The preliminary estimate of euro area real GDP for the first quarter of 2024 yielded positive surprises. For the euro area as a whole, a growth rate of 0.3% was recorded against the last quarter of 2023. This is significantly higher than our forecast of 0.1%. Growth surprised positively in all the larger euro area countries, with the exception of the Netherlands. The strongest growth was again achieved in the Iberian Peninsula (0.7% in Spain and Portugal), while the Italian economy grew by 0.3%. The strong(er) growth momentum in the southern euro area countries, also recorded in the previous quarters, thus continues. The biggest surprise came from Germany. Instead of the expected stagnation, there was 0.2% growth in the first quarter. However, this positive surprise is somewhat engineered by the downward revision of the contraction of the German economy in the fourth quarter of 2023 (from -0.3% to -0.5%). In France, growth was also 0.2%, while the Dutch economy contracted again (-0.1%) - as it did during the first three quarters of 2023. Against the weaker growth rates in neighbouring countries, the growth of the Belgian economy stands out positively at 0.3% for the fourth consecutive quarter.
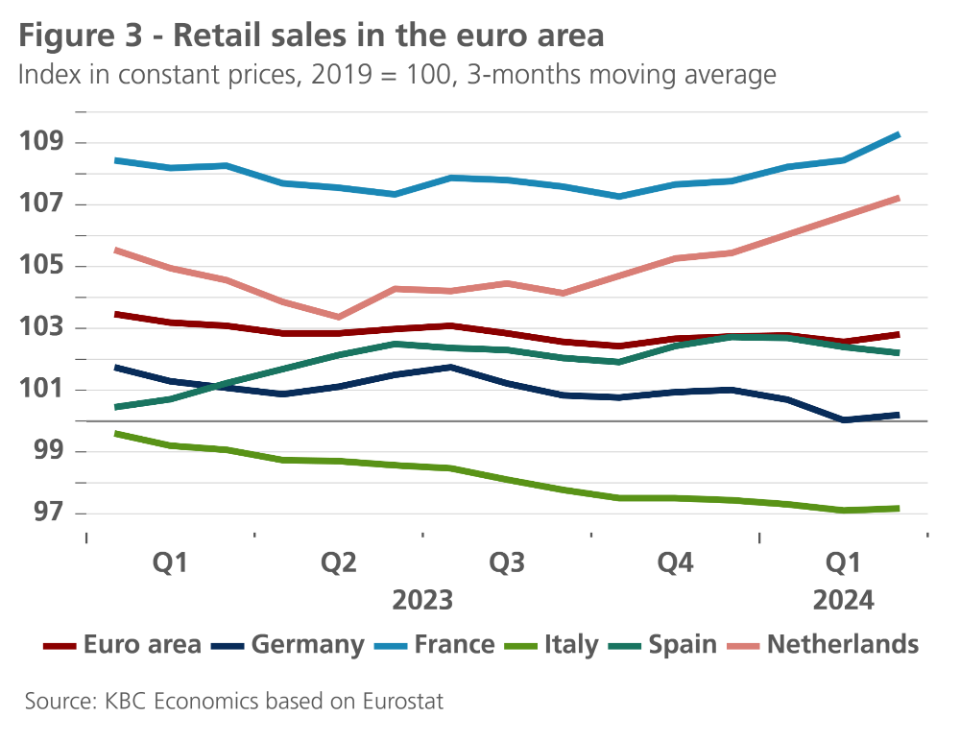
Detailed information on the growth drivers is scarce but suggests that net exports were a major driver of growth in several countries. For now, the growth contribution of private consumption - which is expected to become the strongest driver of the recovery - still varies from country to country. In France it was significantly positive, in Spain rather modest, but in Germany, according to comments by Destatis, the German institute for statistics, it was likely still negative. This mixed picture is also reflected in the recent development of retail sales in the various euro countries (see figure 3).
The positive surprise of the first-quarter growth might give the impression that the economic recovery is emerging earlier and, more importantly, more vigorously than expected. However, such a conclusion seems premature at the current juncture. Confirmation of current figures is needed. Indeed, business cycle indicators generally continue to paint a mixed picture. This is in line with our scenario of a rather laborious and gradual economic recovery. While the Purchasing Managers' Index (PMI) in the services sectors continues its rise, this rise is not observed for industry and construction. PMIs for those sectors remain currently stuck at low levels. The European Commission (EC) indicator on business confidence in industry and construction also maintain their low levels.
The ifo surveys of confidence among German entrepreneurs also paint a mixed picture. The order backlog is in decline, in line with the actual development of new orders. But improvement continues to be expected for the next six months in all sectors (aggregated).
A broad-based rebound of private consumption is needed to additionally and structurally drive growth and support the recovery. For that, the fundamentals remain in place. For example, in the first quarter, employment in the euro area increased again by 0.3%. Compared to a year earlier, 1% more people were employed, while real GDP was only 0.4% higher. The high labour intensity of growth is helping to keep the unemployment rate at a historic low despite ailing economic growth. This labour market resilience is, moreover, accompanied by a gradual recovery in the purchasing power of wages. All this contributes to the fact that, according to the EC's recent estimate, real household disposable income increased by 1.3% in 2023.
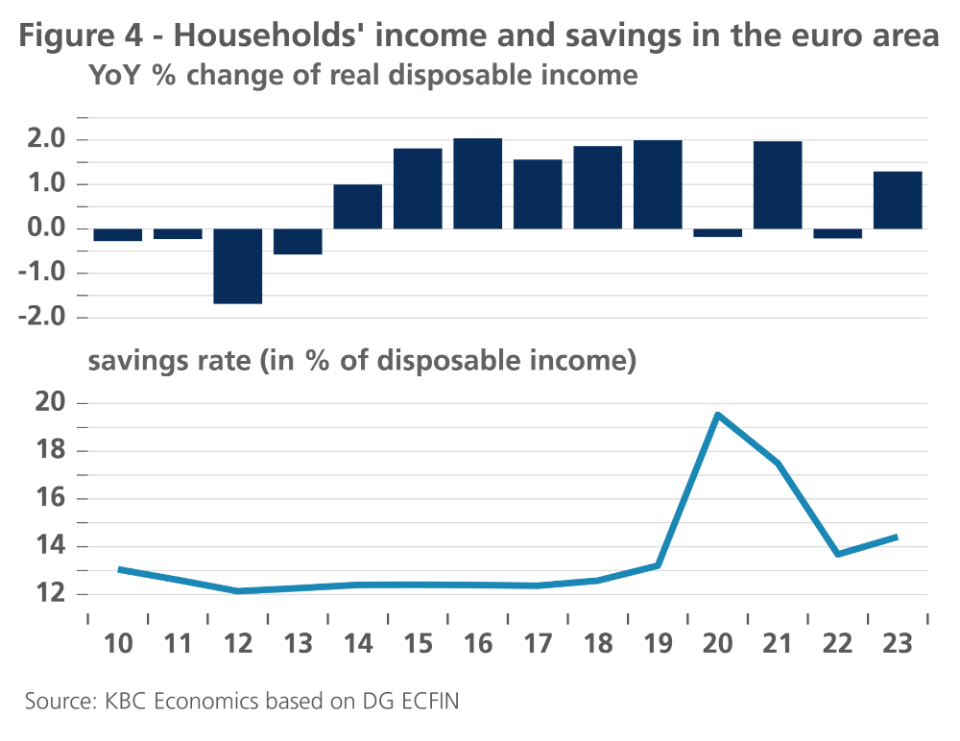
But the recovery of weak consumer confidence is progressing only haltingly. High (international) political and social uncertainty may play a role in this. Consumers may also remain cautious ahead of elections and potential new government measures to reduce budget deficits. According to recent EC forecasts, such fiscal consolidation will be needed not only in Belgium, but also in major European economies such as France, Italy and Spain, among others. By mid-June, the EC will clarify to member states how much effort is needed to comply with the new European governance framework. Following this assessment, member states will (in principle) have until mid-September to draw up four- or seven-year plans that include fiscal measures as well as structural reforms and investments. These plans – and the implied fiscal consolidation - are likely to weigh on further growth in disposable household income, but our expectation is that the measures will not stand in the way of a consumption-led economic recovery. Certainly compared to the drastic cuts after the euro crisis over a decade ago, consolidation efforts will now be spread out more over time and in a number of countries also partially compensated by European-funded investments (NGEU). Some decline in the household savings ratio, still significantly higher than before the pandemic (see figure 4), may also contribute to the further strengthening of household consumption.
We therefore left our expectations for quarterly real GDP growth in the next few quarters unchanged. However, as a result of the stronger-than-expected growth in the first quarter, our estimate of expected average euro area real GDP growth for the full year 2024 has been increased from 0.5% to 0.7%. For 2025, we maintain our growth forecast of 1.3%.
Bond yields past their peak
Long-term bond yields continue to display high volatility. During the past month, US yields fell more strongly than German yields, reducing the spread between the two. One reason was the dovish Fed communication following its May meeting, indicating that the direction of the next policy move would definitely be a rate cut, removing earlier mounting speculation on rate hikes. Moreover, weaker-than-expected macroeconomic data such as Q1 GDP growth, net job creation and retail sales weighed on US bond yields by further tilting market expectations towards eventual easing.
The latest evolution of bond yields strengthens our belief that US and German yields have likely peaked. From current levels, a gradual fall is expected, leading to a bull steepening as policy rates are expected to fall more than longer-term bond yields. The currently inverted curve is expected to become upward sloping again in 2025 in the US. In the euro area, this will take more time as the current curve is more strongly inverted than in the US, implying that the euro area curve will probably be broadly flat at the end of 2025.
Intra-EMU spreads remain subdued for the time being
As was the case in the past couple of months, intra-EMU sovereign spreads versus Germany remain subdued. The main reasons for this are the same: the relative growth outperformance of Southern peripheral economies versus Germany, the current look-through attitude of financial markets regarding the vulnerable fiscal situation of a number of euro area economies (including Belgium), and, last but not least, the availability of the ECB’s Transmission Protection Instrument.
Despite the markets’ current complacency, we continue to expect that intra-EMU sovereign spreads will moderately decompress during the remainder of 2024 to levels that better reflect the underlying fundamentals of public debt. Markets will not be able to ignore indefinitely the strongly heterogenous state of public finances in the run-up to the draft budgetary plans for 2025 under the rules of the new Stability and Growth Pact.
US economy softens a bit
The US GDP figure for the first quarter of this year came in lower than expected. Whereas the consensus forecast stood at 0.6% quarter-on-quarter growth, it only reached 0.4% (see figure 5). The lower GDP figure has several causes. The growth contribution of private consumption weakened (from 0.55 to 0.4 percentage points), mainly due to lower growth in goods consumption (which was even negative). Consumers seem to be increasingly exhausting their covid savings buffers. The savings rate fell to 3.6% from 4% last quarter. Lower real income growth also weighed on consumption last quarter. Stagnating April retail sales suggest we could see the growth contribution of consumption decline further in Q2.
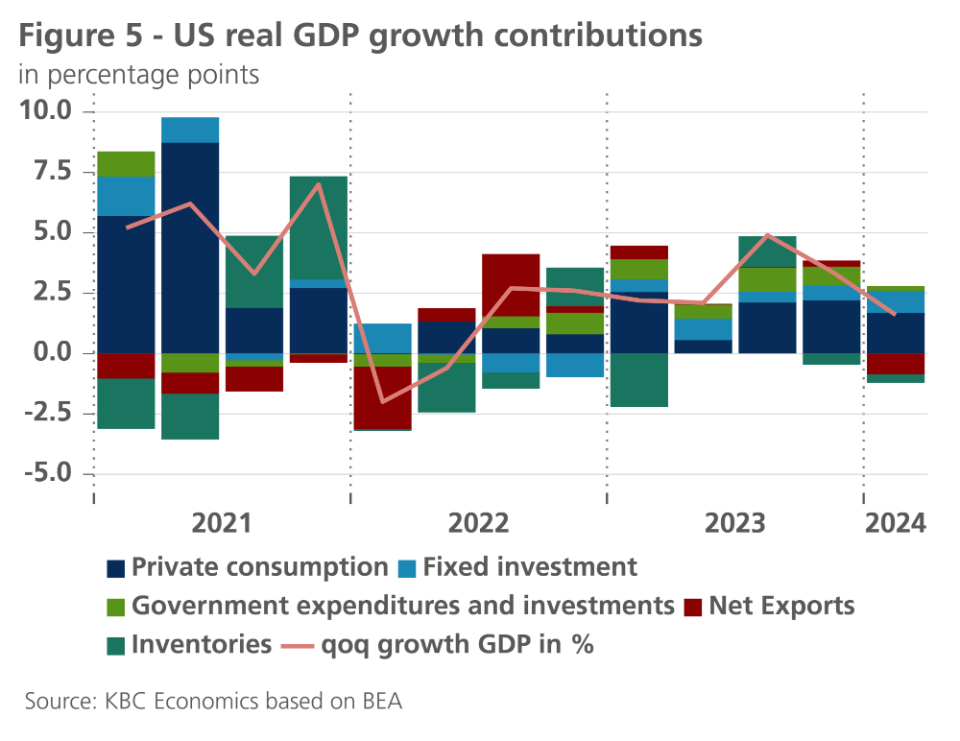
The contribution of government spending also fell significantly. Local governments in particular contributed less. And for the second quarter in a row, inventories made a negative contribution. The biggest culprit, however, was net exports. It made a negative contribution of 0.22 percentage points this quarter. The combination of a strong dollar and persistent economic problems of major trading partners seem to be negatively affecting US exports. It should be noted, however, that export contributions can be highly volatile.
The exception to the rule was fixed investment, which contributed positively with 0.23 percentage points. The rise in residential investment was particularly notable. Lower mortgage rates, already reflecting expected easing, seemed to find their way into the broader economy.
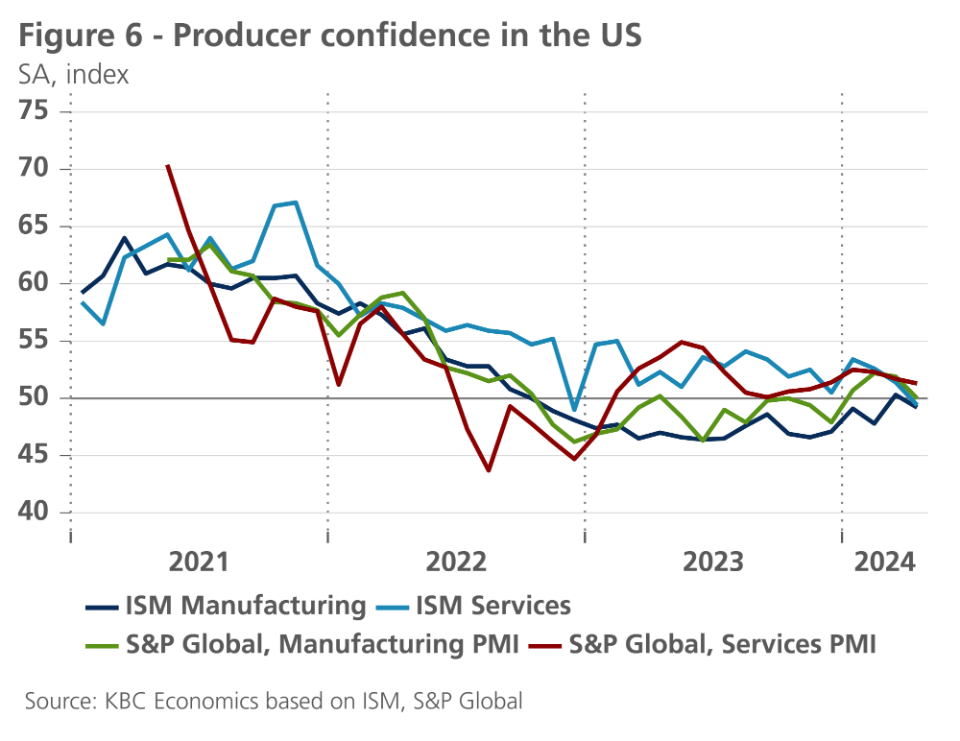
GDP aside, others indicator have come in rather soft lately. In the labour market, ‘only’ 175k jobs were added in April. The unemployment rate ticked up from 3.8% to 3.9%, while average weekly hours worked moved down from 34.4 to 34.3. Job openings also fell further, though they remain at an elevated level. Producer confidence indicators also declined markedly (see figure 6). The ISM Survey even reverted to contraction territory (for both services and industry). Consumer confidence also declined sharply. Furthermore, rising protectionism could harm growth from next year onwards. Consequently, we downgrade our 2024 growth forecast from 2.4% to 2.3% and our 2025 forecast from 2.0% to 1.8%.
US dollar loses ground
During the past month, the US dollar depreciated against the euro to 1.08 USD per EUR. This was the result of the above-mentioned weaker macroeconomic data in the US, combined with somewhat better-than-expected euro area data. Related to this, the US-German bond yield differential decreased, which put additional weakening pressure on the exchange rate of the US dollar. We expect the US dollar to remain around current levels in the coming months, before continuing its depreciation path, driven by fundamentals, to reach about 1.09 USD per EUR by the end of 2024.
China’s economy still faces structural challenges
Despite China’s stronger than expected Q1 GDP growth (5.3% yoy), putting the country on target to grow 5.1% in 2024, the same challenges that have weighed on the economy for the past three years remain. Notably, China’s once booming real estate sector is still struggling to find footing, which in turn is keeping consumer confidence especially low while the country’s massive debt load, especially among local governments, makes it difficult to keep relying on old stimulus levers.
Recent developments suggest, however, that the central government is finally trying a new tactic. The issuance of special, ultra-long term bonds last week was already announced back in March at the government’s annual planning meetings. With planned issuance of 0.8% of GDP, it complements the planned budget deficit (3.0% of GDP), bringing the fiscal impulse in line with last year’s revised budget (3.8% of GDP). So, while it doesn’t represent new ‘bazooka’ stimulus to kick start the economy, it is significant because the debt is off-budget and issued by the central government rather than the already heavily indebted local governments.
On top of this, the government announced a new plan to support the real estate sector, and one which finally involves the government (specifically local governments) stepping in to buy real estate projects that can be used for public housing. This could finally help firm up real estate prices, which in turn could boost consumer confidence. The government also announced additional financial measures, such as doing away with minimum mortgage interest rates and lowering minimum downpayments on homes from 20% to 15%. It is too soon to say if these measures will be enough to finally turn the sector around, but it is clear that policymakers are starting to change their game plan.
This may be because China’s other key driver of growth, manufacturing and, specifically, manufacturing exports, are running up against headwinds abroad. With the EU launching a series of investigations into China’s state subsidy practices for green tech (see: Is a green technology war on the horizon?), the US imposing new tariffs on various Chinese imports (see: The impact of Biden’s new tariffs), and US presidential candidate Trump vowing to raise tariffs on Chinese products even higher if elected in November, China looks to be on a collision course with a new - potentially global - trade war. Shoring up China’s domestic economy, therefore, becomes even more important for Chinese authorities.
For now, we continue to expect growth of 5.1% in 2024, before the economy slows to 4.0% growth in 2025. Inflationary pressures remain weak, but the economy avoided deflation in April. We anticipate average annual inflation of 0.6% in 2024 and 2.0% in 2025.
All historical quotes/prices, statistics and charts are up-to-date, up to 21 May 2024, unless otherwise stated. Positions and forecasts provided are those of 21 May 2024.