

Economic Perspectives June 2020
Read the full publication below or click here to open the PDF.

- The reopening of economies in Europe and the US is progressing in relatively rapid strides, and high frequency indicators suggest that the recovery has started in many countries. The pace and strength of that recovery, however, is yet unknown, and it remains likely that a full recovery may take several quarters if not years. What’s more, the possibility that countries see renewed Covid-19 virus waves remains an important risk.
- Revisions to euro area Q1 GDP growth confirm that while countries suffered deep economic contractions as lockdowns were imposed in March, the downturn was fractionally less severe than the original figures suggested. Furthermore, southern European countries and France generally performed worse than northern counterparts. Belgium was in between. However, it remains the case that the growth decline in Q2 will be unprecedented in its severity and broadly based. Because of the slightly less negative Q1 figures and the emerging easing of health-related restrictions on economic activity, overall, we revise up euro area 2020 GDP growth to -9.6% and, mechanically, this less negative outturn for 2020 translates into a downward revision to 2021 growth to 6.2%
- The European recovery will likely be supported by significant policy efforts on both the fiscal and monetary front. The ECB expanded and extended its Pandemic Emergency Purchase Program (PEPP) in early June while the European Commission announced its recovery and resilience proposal (Next Generation EU). These policy developments have supported a decline in intra-EMU spreads and euro strength versus the US dollar over the past month.
- The US economic outlook remains especially clouded by uncertainty related to the trajectory of the coronavirus pandemic. The faster-than-expected reopening of state economies will likely boost growth in Q3 compared to the very weak outlook for Q2. At the same time, a substantial rebound in confirmed Covid-19 cases in a number of large states highlight the risks posed by such reopening. Given improving high frequency indicators and ongoing fiscal and monetary support, however, we have revised up our 2020 growth outlook for the US to -6.5% and slightly revised down 2021 to 4.4%.
- Oil prices have rebounded significantly from the lows reached in April reflecting a faster-than-expected rebalancing of the oil market on both the supply and demand side. Higher demand from Europe, the US and China as these economies have reopened, combined with some production cuts from OPEC+ is driving the rebalancing. The higher oil prices also translate into the prospect of higher inflation in the euro area (0.4%) and the US (0.5%).
As countries around the world begin to emerge from lockdowns imposed to keep Covid-19 at bay, questions regarding the strength of the economic recovery and the future trajectory of the pandemic abound. New data releases continue to highlight the sheer magnitude of the contraction in economic activity caused by the coronavirus crisis. At the same time, the reopening of economies in Europe and the US is progressing in relatively rapid strides, and high frequency indicators such as mobility data suggest that the trough has been reached in many countries and the recovery has started. The pace and strength of that recovery, however, is yet unknown. Throughout April and May, financial markets reacted to the lifting of lockdowns and the abundant policy stimulus pumped into the global economy with extraordinary optimism, leading to an upswing in equity prices, but also to declining government bond rates in vulnerable economies. And yet, it remains likely that a full recovery (i.e. a return to GDP levels seen at end-2019) may take several quarters if not years.
Indeed, despite some positive signals of late, there are still plenty of reasons to remain cautious. The lifting of lockdowns is only partial and social distancing policies will remain in place for some time. What’s more, the extent to which the crisis has destroyed output potential remains unclear, but some labour market data, for example in the US, suggest that not all job losses are likely to prove temporary. On the virological front, Covid-19 has not disappeared and presents an ongoing risk to any recovery. In most European countries, new daily case rates and deaths have been on a downward trajectory for several weeks, but the possibility of second waves emerging as people isolate less and move around more freely should not be discounted. In the US as a whole, new cases have plateaued, but certain states are still seeing a somewhat alarming increase in confirmed cases. And in many emerging markets, such as Brazil, India and South Africa, case rates have yet to decline or even plateau. Even in China, an uptick of cases in Beijing has led to some new restrictions on movement. Finally, a number of other risks remain on the horizon, such as deadlines related to Brexit negotiations and the re-emergence of US-China trade tensions and geopolitical wrangling.
Given ongoing uncertainty about the trajectory of Covid-19, we maintain three different scenarios to guide our economic outlook. In our base case (45% probability), the spread of the virus remains under control, and the lifting of lockdowns continues as currently foreseen, with social distancing measures remaining the norm. In the pessimistic scenario (40% probability), new waves of the virus emerge resulting in future lockdowns imposed either at the government level or societal level (i.e. people self-isolate of their own accord). We also still maintain an optimistic scenario in which large scale testing or breakthroughs in viral treatments significantly lower the risk of the virus spreading, which would allow lockdowns to be permanently and more completely lifted in the short term. To this scenario, however, we assign only a 15% probability.
The multi-scenario approach that we introduced at the outbreak of Covid-19 is currently being followed by international institutions too. Organizations such as the OECD assign similarly high probabilities to a second-wave scenario as well. Hence, the potential economic damage caused by a new Covid-19 wave is generally considered the main risk to the mainstream economic outlook, which itself consists of a very strong recovery in the following quarters.
Europe still hurting, but policy picture brightens
Despite marginal upward revisions to Q1 GDP figures, the picture for the first quarter of the year in the euro area as a whole remains mostly unchanged. Across the board, countries suffered deep economic contractions as lockdowns were imposed in March. However, the revisions do indicate that the downturn was slightly less severe than the original figures suggested. Furthermore, there was substantial variation across the euro area. Countries like Spain, Italy and France saw much steeper drops in GDP growth compared to the fourth quarter of last year (approximately 5.3 ppts) than countries like the Netherlands and Germany (between 1.7 and 2.2 ppts, respectively).
It is likely no coincidence that Spain, Italy and France all had fairly severe experiences with Covid-19 as measured by confirmed deaths per capita. However, another factor that might explain such divergence is the greater share of GDP derived from tourism in Spain (11.8%), Portugal (8%), France (7.3%) and Italy (5.9%) compared to the Netherlands (4.4%) and Germany (3.8%). Indeed, the tourism and hospitality sectors have been hit particularly hard by the coronavirus crisis with the closure of hotels, restaurants and international borders. Another factor that may have driven the intensity of contractions in various countries is the relative importance of SMEs versus large companies (as smaller companies are likely more vulnerable to exogenous shocks).
Looking forward, Q2 was likely markedly worse than Q1 in terms of the magnitude of growth contractions seen across Europe. Lockdown measures, such as work-from-home and stay-at-home requirements were introduced only toward the middle of March in most countries and remained in place for all of April. Governments started to lift these measures in May, but only to a limited extent. Some degree of work-from-home measures, for example, are still in place in a number of countries, and where businesses have reopened, social distancing measures are often enforced.
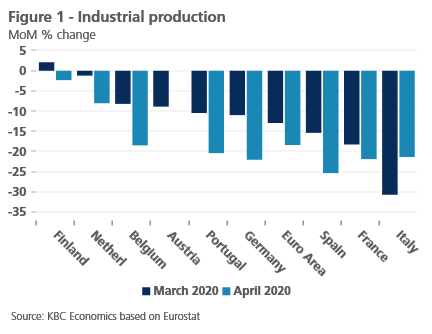
Both hard data and sentiment data also point to significant weakness in Q2. Industrial production, for example, was much weaker in month-over-month terms in April compared to March in most countries (with the notable exception of Italy) (Figure 1).
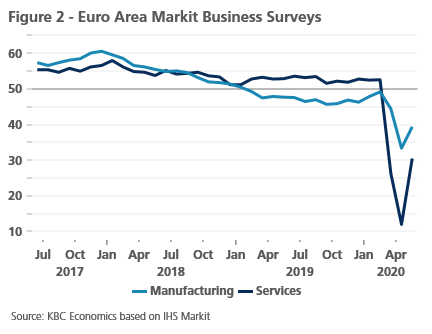
Meanwhile, business surveys on both the services and manufacturing sides of the economy suggest that sentiment hit a low in April but still hasn’t recovered to expansionary territory (a reading above 50) (Figure 2).
However, there are signs that the extent of the contraction in 2020 will be slightly less severe than previously anticipated. First, Q1 appears to have been marginally less weak than first estimates suggested. Second, the virus seems to have come under control in most European countries – at least for the time being – and the lifting of lockdowns, even if only partial, will have a positive impact on economic growth. Third, sentiment does appear to be bottoming out even if it remains weak. And fourth, policy responses have led to better financial conditions and a fiscal impulse that should support the economy this year and beyond. Thus, in our base scenario, we have revised up 2020 growth in the euro area to -9.6% from -11.0% previously. The carryover impact of this revision translates mechanically into a marginal downward revision of our growth outlook for 2021 to 6.2% from 6.9%.
European risk on
Since mid-May, intra-EMU spreads have eased, likely reflecting positive policy-related developments. On the fiscal policy side, the European Commission announced its ‘Next Generation EU’ recovery and resilience proposal on 28 May. While the process may not be straight forward given differing views across member states, the proposal is expected to be approved given support from both Germany and France and could boost Europe’s medium-term recovery after the coronavirus crisis (for more details on the European recovery plan, see Box 1). Though the proposal is mostly investment-focused, it may be considered a step in the right direction for European fiscal solidarity. The latter comes on top of various new fiscal stimulus initiatives by the EU member states. In particular, Germany stands out with a substantial fiscal stimulus programme, including a temporary reduction of its VAT in the second half of 2020. Most countries are implementing packages containing many different measures. These still focus on financial support for households and businesses to stabilize the economy, rather than boosting the recovery. The degree of stimulus varies from country to country raising concerns about distortions to the European single market due differing amounts of state aid.
Box 1: European Commission puts extra money in the bag
Under the buzzing title 'Next Generation EU', the European Commission (EC) proposed a new temporary EUR 750 billion recovery plan for the EU economy at the end of May 2020. This new initiative comes on top of earlier stimulus initiatives. The EC will raise this money from the capital market between 2020 and 2024 through loans that it will only repay between 2028 and 2058. EUR 500 billion will be channelled to Member States in the form of grants, either directly (EUR 450 billion) or through guarantees from the European Investment Bank or national investment banks. Member States will therefore not have to repay that money. In this way, the EC will make an extra contribution to the economic recovery from the corona crisis. The EC will also lend EUR 250 billion to Member States, which will have to be repaid. In this way, all Member States can benefit from the excellent creditworthiness of the EU.
In order to repay its own loans from 2028 onwards, the EC wants to be able to collect additional 'own resources'. It is thinking, among other things, of the proceeds of levies on the trade in emission rights and of taxes on the European turnover of large digital multinationals.
Approximately 80% of the recovery plan is intended to support investments. The new Recovery and Resilience Facility to be created is the most important channel for this (EUR 560 billion, of which EUR 310 billion in grants and EUR 250 billion in loans). The Member States will be able to call on this 'helpline' from the EU budget to finance investments and reforms to make their economies greener, more digital and more competitive. To this end, they will have to draw up Recovery and Resilience plans within the framework of the European Semester, the procedure set up during the euro crisis in order to make the macroeconomic policies of the member states more focused and better coordinated. Budgets will only be available in the coming years when agreed milestones are reached.
Another new initiative will mobilise EUR 55 billion of additional resources for cohesion policy in the short term. This policy aims to reduce disparities in economic development and income disparities between EU countries. The proposed adjustments can also take into account the impact of the corona crisis. The guarantees will be used as a base for two new 'levers'. Through the mobilisation of private capital, the aim is to multiply the resources that can be used as capital support for (1) companies affected by the crisis but fundamentally sound (solvency support instrument, EUR 31 billion) or (2) investments that enhance competitiveness (strategic investment facility, EUR 15 billion). A new EU4Health programme will have a budget of more than EUR 9 billion.
Most of the remaining funds will go to strengthening existing EU programmes and funds. The budgetary orientations of these programmes and funds will be laid down in a seven-year schedule in accordance with EU commitments. The current multi-annual budget expires at the end of 2020. The new one has not yet been adopted, although the first proposals for it date back to the previous EC, under Juncker's presidency. Together with the 'Next Generation EU' proposal, the EC now proposes a modified and extended multi-annual planning, so that EU leaders can make a decision on the package.
Rapid adoption of the package is unlikely. But an adoption later in 2020, probably after some amendments, can be expected. A few days before the announcement of the EC proposal, France and Germany had already launched a similar proposal. Their political agreement is likely to outweigh the opposition of four very reluctant countries. Moreover, the increase in funding for cohesion policy is likely to reduce the initial resistance of central and eastern European countries to the original proposals for the multiannual plan.
‘Next Generation EU' would mean a significant strengthening of crisis management at the European level, in particular for the poorer countries and regions. Although the overall sum of EUR 750 billion in relation to the EU's GDP is limited, support for individual countries can be very significant. It is positive that this aid is mainly focused on investment, as it helps to structurally strengthen the economy. Because investment takes time, the plan will support economic recovery in the medium term rather than boost it in the short term.
Still, ‘Next Generation EU’ does not bring about a real institutional strengthening of the EU. Admittedly, the concept of European loans that will be repaid with European taxes is a step in the direction of a fiscal union. Such a step is essential for the stability of the euro area. However, from this point of view, the limited size of the plan is a significant shortcoming. Moreover, the recovery plan is limited in time (until 2024). The step back is therefore included in the plan from the outset.
On the monetary policy side, the ECB further eased policy and to a somewhat greater extent than envisaged at its latest meeting with an expansion and extension of the Pandemic Emergency Purchase Program (PEPP). In particular, the ECB increased the size of the PEPP from EUR 750 billion to EUR 1,300 billion and signalled that the purchase program will run until at least end-June 2021 rather than December 2020. Furthermore, maturing purchases will be reinvested until end-2022. These actions together signal that very accommodative ECB policy will be present for an extended period, which in turn has reassured markets and contributed to intra-EMU spread compression.
These favourable developments, in terms of significant additional policy support for the euro area economy, are also likely the driving force behind recent euro strength vis-à-vis the US dollar. Short-term, some of the euro-positive news might be discounted. A flaring up of global risk aversion (driven e.g. by coronavirus-related uncertainty) might slow the USD correction in Q2 and Q3. Further out, we expect the USD decline to resume and EUR/USD to gradually unwind its fundamental undervaluation.
No Brexit extension envisaged. Some optimism on a deal emerging.
The UK has formally indicated that it will not be seeking any extension to the withdrawal process and will exit the EU fully on 31 December 2020. While reports from both sides of the negotiations suggest very little progress has been made on future relations so far, there have also been positive indications from both sides that progress could be made in stepped-up discussions through the Summer. One element in this regard is the belief that Germany’s six-month presidency of the EU will bring greater political focus and capacity to the negotiation process. The British Prime Minister, Boris Johnson, has even suggested it might be possible to have a deal agreed to by July.
A likely failure to make progress in a number of stipulated areas such as fisheries in the next month or so will probably heighten concerns about a ‘no deal’ Brexit. This may be amplified by the belief on both sides that the other will be willing to make more concessions as we get closer to end-year. While the risk that the UK could ‘crash out’ of the EU without a deal has increased, it remains a limited likelihood.
The lack of significant progress thus far in negotiations makes it likely that any agreement between the UK and EU is ‘narrow and shallow’ rather than wide reaching. This implies a ‘bare-bones’ deal on trade in goods with virtually nothing on services. A limited trade agreement would result in a ‘managed but messy’ exit of the UK from the EU at the end of the year. This will likely entail some increase in trading frictions between the UK and its key trading partners in the EU.
US jumps to reopen, despite risks
The US economic outlook remains especially clouded by uncertainty related to the trajectory of the coronavirus pandemic. State governments have started to lift lockdown measures, but unlike in the euro area, the US as a whole hasn’t seen a sustained decline in the number of new confirmed cases. Indeed, there appears to be significant divergence across states, with some appearing to have brought the spread of the virus at least partially under control and other states seeing a rapid rise in cases as economies have reopened. While some of this may be attributable to increased testing, it also highlights the risk that a second wave in the US could derail the economic recovery.
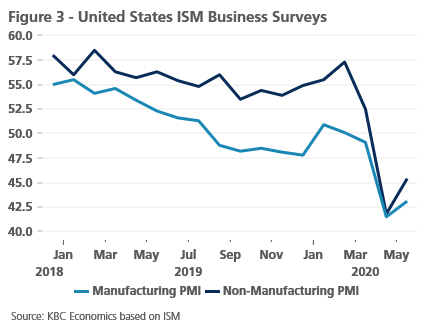
Despite these risks, in our base scenario, the quicker than expected reopening of economies should have a positive impact on Q3 growth relative to the very steep decline expected in Q2. The New York Fed’s weekly economic index points to a year-on-year growth decline of about 10% in Q2, which also equates to a roughly 10% decline relative to Q1. Sentiment data supports this view, with the ISM manufacturing and non-manufacturing indices remaining very weak in May, despite being somewhat artificially boosted by supplier delivery delays (Figure 3). Hard data also point to an especially weak Q2, with retail sales falling 17.8% yoy in April (but recovering to -1.4% yoy in May) and industrial production falling 15% yoy in April (-15.3% yoy in May).
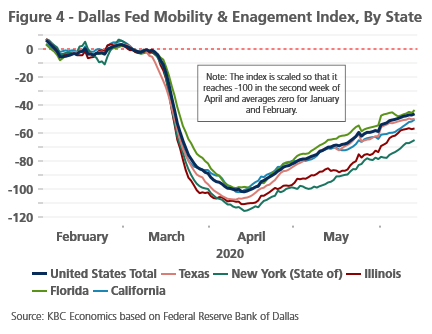
Higher frequency data, however, point to some improvement. Mobility data as measured by the Dallas Fed, Apple and Google all show that activity among Americans has picked up notably since April, when lockdown measures were most strict (Figure 4). However, there are some caveats to this data. First, mobility has not returned to pre-coronavirus levels. Second, Apple data shows that while more Americans are driving or walking places, the use of transit remains highly supressed. Third, while Google mobility data shows that people are spending more time out of their houses at places like parks, time spent at work or engaging in retail and recreational activities is still very low.
Thus, while we can expect to see some relative recovery in Q3, the size and extent of that recovery remains unclear. The decimation of the US labour market in recent months remains an important factor that could hinder the strength of the recovery. And although the most recent jobs report in the US surprised to the upside with 2 million net payroll gains, it is too soon to say whether this will be a sustained pattern that contributes to a swift, v-shaped recovery (for more details see box 2).
Box 2 – US labour market surprises with job gains
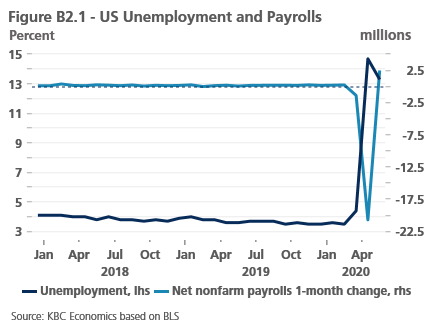
US labour market data surprised to the upside in May, with a net gain of 2.5 million payrolls. Consensus had expected several million more job losses after a devastating March and April (Figure B2.1). The unexpected job figures do indicate an improvement in the labour market, likely reflecting the fact that state economies across the US have started to reopen and, possibly, the impact of the Paycheck Protection Program (PPP), a government program that provides loans to businesses with incentives to keep workers on their payrolls. After all, labour force classification data shows that in May, employed workers fell by about 4.7 million while unemployed to employed workers rose by 6.5 million, suggesting that the net job creation in May reflects job gains offsetting still sizable job losses.
A careful look at who received PPP loans, however, suggests that while the PPP might be driving job gains for some sectors (such as construction), the opening of the economy was likely still an important factor for the gains in the leisure and hospitality sector. For example, of the PPP loans approved though 12 June 2020, the largest percent went to the health care sector (12.94%), professional services (12.75%), construction (12.42%), manufacturing (10.45%), and accommodation and food services (8.04%). In contrast, the majority of job gains in May came from leisure and hospitality (39%), construction (14%), education and health services (13%), retail trade (12%) and other services (9%).
The upside surprise, however, needs to be considered within the larger context of the labour market’s current state, which is exceptionally weak after being decimated in April and March. Over those two months, 22 million jobs were lost due to the fallout from the coronavirus crisis, nearly a third of which came from the leisure and hospitality sector. The unemployment rate reached 14.7% in April, and the Bureau of Labor Statistics notes that this figure likely would have been higher had it not been for a large number of workers classified as ‘employed but absent from work’ rather than unemployed in recent months. Thus, even though the unemployment rate declined in May to 13.3%, this is still well above levels seen pre-crisis (3.5% in February), and likely does not fully capture the true state of the labour market.
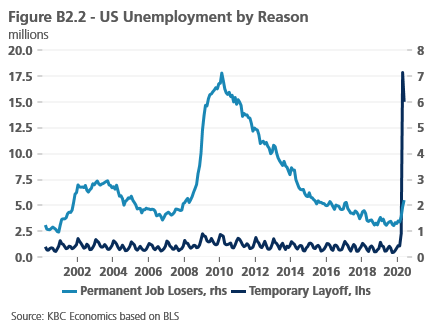
Going forward, it will be important to monitor developments related to permanent job losses in particular. For although temporary job losses drove the sharp increase in unemployment since February, if a significant portion of these temporary job losses become permanent job losses, the recovery in the US will likely be held back. In May, for example, those on temporary layoffs decreased to 15.3 million, but the number of permanent job losers increased to 2.3 million (figure B2.2). Related to this, watching the development of initial and continuing unemployment claims will be important. Initial claims have been trending down for several weeks, but still remain at high levels, while continuing claims have hovered just above 20 million for the past 4 weeks. At the same time, however, though the flexibility in the US labour market (compared in particular to the EU labour market) was likely a contributing factor to the massive spike in job losses seen in previous months, it could eventually contribute to a substantial rebound in hiring down the road.
Similar to in Europe, however, a sizable policy response on both the monetary and fiscal fronts will likely help ease the magnitude of the contraction and help support the recovery. On the fiscal side, the US has passed legislation amounting to support worth roughly USD 3 trillion. This fiscal push came relatively quickly and provided loans to small businesses, tax rebates to individuals, increased spending for hospitals and an extension of unemployment benefits among others. Though some efforts to pass further stimulus bills have stalled (e.g. the Heroes Act, which was passed by the House of Representatives in May), there appear to be growing discussions among lawmakers that further stimulus might be necessary.
On the monetary front, the Fed remains committed to keeping interest rates low for long and reinforced this at their latest meeting via the dot plot, which shows most committee members expect to keep interest rates at current levels through 2022. Fed Chair Jerome Powell also noted that they are “not even thinking about thinking about raising rates.”
Given the strong fiscal and monetary response, the faster than expected opening of the economy, and some signals that Americans are eager to forego lockdown measures despite the ongoing prevalence of the virus, we revised up our 2020 outlook for US GDP growth to -6.5% vs -8.0% previously. In turn, this less adverse outturn this year mechanically implies a downward revision to our 2021 GDP outlook from 6.5% to 4.4%.
Higher oil prices, higher inflation
The oil market has seen a sizable shift in the past month and a half, with oil prices rebounding significantly from the lows reached in April. This has reflected a faster-than-expected rebalancing of the oil market on both the supply and demand sides, with more of an emphasis on the demand side. In particular, the relatively rapid reopening of economies in Europe and North America, as well as the ongoing recovery in China, have contributed to expectations of a faster recovery in demand. On the supply side, OPEC appears to have shifted its priority away from gaining or maintaining market share, and towards maintaining a more sustainable price range. Furthermore, the OPEC+ production cut extension until the end of July, as well as voluntary cut contributions by some members, also supports the rebalancing in the market. Therefore, we now expect Brent prices to reach USD 48 per barrel by the end of 2020.
Higher oil prices also translate into an expectation of higher inflation in 2021 for both the euro area and the US. In the euro area in recent months, inflation changes have been driven mostly by food prices and energy prices (which have moved in opposite directions), while core inflation has eased only modestly. Given stickier core inflation and the revision to oil prices, we now expect euro area inflation to ease to only 0.4% on average in 2020 and to increase slightly less in 2021 to 1.5%. The US has also seen energy prices decline and food prices rise, but core inflation has also moved lower since the beginning of the year. Given the rebalancing seen in the oil market, however, we also revised up our outlook for US inflation for 2020 to 0.5% and revised down 2021 inflation marginally to 1.9%.
China and emerging markets send a mixed message
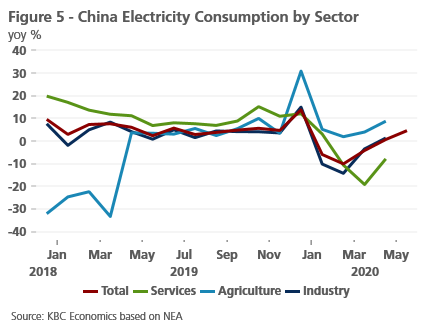
One bright spot in the global economic outlook remains the economic recovery in China, which one might even call ‘V-shaped.’ Industrial production grew a positive 3.9% yoy and 4.4% yoy in April and May, respectively. Vehicle sales and vehicle registrations have also returned to positive year-over-year growth and sentiment data has recovered to expansionary territory. However, data like retail sales and electricity consumption suggest that the services sector might be lagging in the recovery (Figure 5). What’s more, the aforementioned uptick in Covid-19 cases in some regions highlights that the risk presented by a second wave of the virus is applicable to China as well. We therefore maintain our outlook of the Chinese economy growing only 1.0% in 2020 before recovering to 8.8% growth in 2021.
Certain other emerging markets, however, provide less reason for optimism, particularly in Latin America, which has become the new epicentre of the virus. Business surveys suggest that sentiment remains very low and industrial production data for April shows year-over-year declines ranging from -25% in Brazil to -55% in India. Thus, we continue to expect the coronavirus crisis to hit emerging markets particularly hard, though significant heterogeneity across these economies means some countries will perform better than others. For example, the hits to industrial production for Taiwan, South Korea and Vietnam have been relatively less severe.
All historical quotes/prices, statistics and charts are up-to-date until 15 June 2020, unless otherwise stated. The views and forecasts provided are those of 15 June 2020.