Economic Perspectives September 2020
Read the full publication below or click here to open the PDF.

- The recovery from the sharp economic contraction inflicted by the Covid-19 pandemic continues, though there remains substantial uncertainty surrounding the strength of that recovery. The downside risks continue to outweigh the upside risks, but there are signals that the worst is behind us and that new strict lockdowns are less likely going forward given rising objections in society, but also thanks to more efficient and targeted precautionary measures. This, on balance, leads to a slightly more optimistic picture, though our overall economic outlook is still relatively cautious.
- In the euro area, the retail sector has taken the lead on the recovery while the industrial sector and exports are lagging behind. There are also clear divergences between countries, both in terms of epidemiologic developments and the pace of the economic recovery, with Spain on one side suffering significantly and Germany on the other side outperforming the rest of the euro area. Outside the euro area, the dramatic fall in British GDP in the second quarter and the continued problematic epidemiologic developments in the UK should be noted. Central and Eastern Europe suffered substantially from the Covid-19 crisis too, with similar differences across countries.
- Short term indicators in the US continue to point to an ongoing rebound in economic activity, and US employment data show that the labour market continues to recover. At first glance, the economic recovery in the US appears to be more convincing than in Europe. However, weak consumer confidence and some softness in underlying trends in the labour market warrant caution, while the upcoming US presidential election is a growing source of uncertainty.
- Inflation dynamics in the euro area and the US have diverged, with euro area inflation declining and US inflation starting to pick up. While the euro area dynamics may reflect one-off developments, associated divergences in inflation expectations are one factor that have driven recent USD weakness against the euro. In particular, rising inflation expectations in the US, among other factors, have contributed to lower real interest rates in the US, which in turn has led to dollar weakness, which we expect to continue.
- We continue to expect that ECB and Fed policy will remain at current accommodative levels through 2021. As a result, government bond yields and intra-EMU spreads will remain around current levels, with little room for upward movement. The Fed announced a potentially significant shift in its policy framework that means in the future inflation above the inflation target will be tolerated to compensate for lower inflation levels in recent years. This change is generally regarded as a clear signal that policy rates will remain lower for longer, in order to boost the economic recovery.
- China’s economic recovery remains remarkably strong, though there is a clear divergence between the industrial side of the economy, which has fully recovered, and the retail side, which is lagging behind. Risks surround the Chinese recovery as well, but overall, we expect China to be the only major economy with positive real GDP growth in 2020 at 1.8%. In contrast, many other large emerging markets, such as India and South Africa, suffered extremely sharp contractions in Q2, are still struggling to contain the spread of Covid-19, and will likely face a much slower recovery path.
The world economy has begun to claw its way out of the abyss caused by the Covid-19 shock. After a disastrous first half of the year, economic indicators suggest that the recovery, which started to take hold at the end of the second quarter in Europe and the US, continued into the third quarter. Mirroring uncertainty around the likely trajectory of the coronavirus, there is still substantial uncertainty surrounding the strength and path of the economic rebound. However, downside risks continue to outweigh the upside risks. At the same time, there are clear signs that the worst is behind us and that the likelihood that countries will return to the strict lockdowns seen earlier this year is minimal in the main economies. As such, our outlook is on balance more positive than last month, but we maintain a relatively cautious view overall.
We continue to signal the high uncertainty caused by the pandemic by maintaining an optimistic and pessimistic scenario in addition to our base scenario. In line with our somewhat more positive view, we have increased the probability we attach to the base scenario (a slow but steady recovery) from 45% to 50% and have decreased the probability of the pessimistic scenario (a protracted and slower recovery potentially hindered by setbacks from the virus) from 40% to 35%. The optimistic scenario (a swift recovery with minimal structural damage to the economy) remains the least probable scenario at 15%.
Divergences in the pace of recovery, both globally and between European countries, are also becoming more apparent. Within the euro area, northern countries, and in particular Germany, appear to be on stronger economic footing than southern countries, with Spain a clear underperformer. The recovery in the US, meanwhile, appears to be picking up, but significant risks remain, especially surrounding the still decimated labour market. China stands out as being ahead of the curve, having borne the brunt of its lockdown in Q1 and already seeing positive year-over-year GDP growth in Q2. Other emerging markets, like India, South Africa, and Brazil meanwhile, are still struggling to contain the spread of the coronavirus and registered sharp GDP contractions in Q2. Besides the ongoing downside risk posed by Covid-19, other important global risks remain on the radar, including Brexit negotiations, trade and other geopolitical conflicts (particularly between China and Western countries), and the upcoming US elections in November.
Divergence in Europe
Revisions to Q2 GDP growth in euro area countries confirm that the first half of the year witnessed a drastic economic downturn, though there were some negligible upward revisions to the data. The revised data also confirm notable differences within the euro area, with Germany contracting only -9.7% qoq in Q2 while France and Spain contracted -13.8% and -18.5% qoq, respectively. Developments related to the trajectory of the pandemic also differ along these lines, with France and Spain seeing daily increases in the number of confirmed cases per inhabitant that exceed the levels reported during the height of economic lockdowns in March and April, according to ECDC data, and that remain far higher than what is currently seen in Germany.
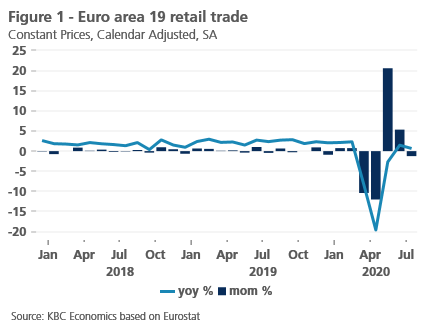
The economic rebound is underway, however, and any appetite for a return of strict lockdown measures seems to have abated. In the euro area, retail trade has led the recovery, registering positive year-over-year growth rates in both June and July. On a monthly basis, however, there are some signs that the pace of the recovery is fading, as retail sales fell -1.3% mom in July after registering increases of 20.6% and 5.3% mom in May and June (figure 1). Furthermore, we see that consumer confidence is starting to fade or stabilize at still low levels in countries that have experienced a fairly strong ‘second wave’ of the virus (like Spain, the Netherlands, and France). Meanwhile, consumer confidence continues to recover in Germany (see Box 1: The Predictive Power of Consumer Confidence).

Box 1 – The predictive power of the indicator of consumer confidence
The monthly indicator of consumer confidence is closely monitored by economic and financial analysts since it is assumed to serve as a leading indicator for the future evolution of private consumption. Especially during periods of high economic uncertainty, like the current Covid-19 shock, the indicator is a widely quoted figure. Uncertainty, caused e.g. by a threat of unemployment, indeed can undermine consumers’ financial positions and therefore their willingness to spend.
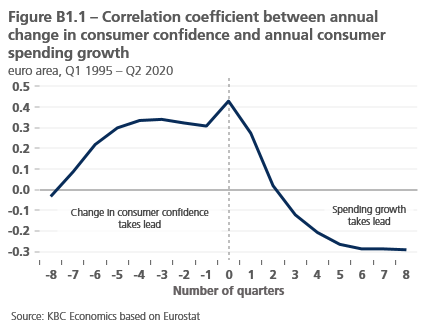
The usefulness of confidence in assessing the future path of consumer spending can be determined based on the correlation between the two. Assuming that it may take a certain time for sentiment to feed through into spending, the lead correlation coefficient can be used to determine to what extent the annual movement in consumer confidence anticipates annual spending growth. Figure B1.1 gives the lead (and lag) correlations for the euro area over the period Q1 1995 - Q2 2020. Surprisingly, it shows that the maximum correlation (0.43) is reached when the annual change in confidence coincides with annual spending growth. This indicates that sentiment is on average transmitted into spending rather quickly. The confidence indicator therefore is a useful tool for nowcasting consumer spending in the ongoing quarter, data of which are published only with a delay, rather than for forecasting future spending.

The correlation however is barely lower (at around 0.30) when the change in consumer confidence leads spending growth by a number of quarters. One reason is that there are differences among member states. In e.g. France and Spain, the highest correlation is again reached when the two are in sync, while for Germany and Italy the maximum correlation is seen when the lead of confidence is even four quarters (but again the correlation results do not differ much when considering different leads). Moreover, the relationship between confidence and spending may vary over time, resulting in a different number of leading quarters in different periods.
All in all, the correlation coefficient is rather low. A possible reason why shifts in consumer confidence do not perfectly match with the dynamic of consumer spending is that sentiment tends to jump around more than spending. Consumers sometimes take an extremely positive or negative view of the economic situation, but provided this does not have significant implications for their individual financial situation, they do not alter their willingness to spend proportionately. This relative volatility of confidence often reflects the fact that non-economic factors (e.g. weather conditions, terrorist attacks, political news) also affect confidence. The non-perfect relationship implies that caution is warranted when drawing strong conclusions about consumer-spending growth from confidence figures.
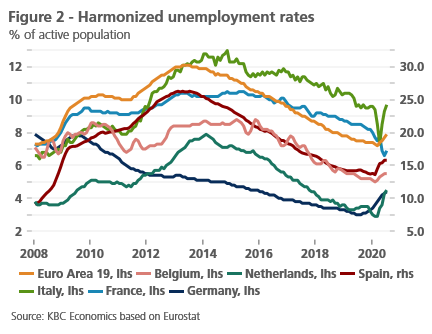
In contrast to the retail sector, the rebound in the industrial sector has been slower, but industrial output and industrial confidence both continue to signal that a steady recovery is underway. Exports, meanwhile, are the main laggard of the recovery in the euro area, with export volumes still heavily depressed. But a pickup in export orders in August may signal that an improvement in external trade is on its way, especially in Germany (as well as France). Finally, while we are starting to see some of the negative impact of Covid-19 on the labour market in the euro area, most countries have extended, or are soon likely to extend, temporary unemployment schemes that were introduced to mitigate the consequences of lockdown measures (figure 2).

Lower inflation and a stronger euro
Meanwhile, euro area inflation has eased further, with both core and headline inflation decelerating in August (headline inflation dipped into deflationary territory at -0.15% yoy according to the latest ECB flash estimate). As a result, we have lowered our outlook for 2020 inflation in the euro area from 0.7% to 0.4% yoy. At the same time, it is important to note that the especially low August figure may represent some one-off developments, such as the postponement of sales periods in several countries due to the pandemic. Furthermore, we expect the negative supply-side shock of the pandemic, which would generally lead to higher inflation, to come into play next year. As such, we have not changed our view on 2021 inflation, which we expect to reach 1.5% yoy.
Lower inflation and inflation expectations in the euro area may be a contributing factor to the appreciation of the euro relative to the USD in recent months – though overall the moves have been driven more by dollar weakness then by euro strength. Still, lower inflation in the euro area and higher inflation in the US have translated into an increasing real interest rate differential between the two. The decline in the dollar also coincided with a rise in Covid-19 cases in the US, and furthermore, it may reflect the Fed’s adoption of an average inflation target, which will allow for inflation overshoots over a certain horizon and implies the prospect that US monetary policy will remain extremely accommodative for a protracted period. While we had already anticipated a weakening of the USD this year and in the long run, recent developments have led us to revise our outlook such that the euro will be stronger versus the dollar than previously anticipated at the end of this year and the next.
Our revised outlook for euro area inflation and for the euro-dollar exchange rate, however, do not impact our outlook for ECB policy, which we expect to remain at current very accommodative levels until the end of 2021. We also therefore expect only very minimal upward movements in government bond yields toward the end of this horizon and anticipate that the ECB’s very accommodative policy will keep intra-EMU spreads at current low levels. The major bond markets have been remarkably stable in recent weeks with longer term rates oscillating around recent levels. We expect only a very gradual upward movement in 10-year government bond yields in line with the economic recovery path and gradually accelerating inflation.
Brexit negotiations are now reaching a critical and contentious stage. Partly because of an understandable focus on the Coronavirus, little progress was made in eight rounds of negotiations between the UK and EU held since the spring. Both sides are accusing the other of being unwilling to compromise on a range of issues running from access in areas as diverse as fisheries to financial services to obligations in respect of ensuring a ‘level playing field’ centred on the particularly vexed question of State aid.
It was generally expected that September would see a step-up both in talks and threats. However very few expected anything like the furore that followed the UK’s announcement of the intention to pass into legislation its ‘Internal markets bill’ that one minister acknowledged amounted to a breach of international law albeit in a ‘specific and limited’ way. The bill is intended to overrule some elements of the Northern Ireland protocol in the Withdrawal Agreement concluded by Boris Johnson’s British government with the EU late last year. Although the protocol contains clear safeguards against such outcomes, the UK government now claims that in the event of no deal, the EU could use the protocol to affect trade between Northern Ireland and the rest of the UK as well as limit the freedom of the UK to provide state aid.
The UK’s exact motivation for taking this aggressive and antagonistic action is unclear. Some suggest it is an attempt to force the EU’s hand either to make substantial concessions or to walk away from talks and be blamed accordingly. Others argue that it reflects failings in UK political circles to properly understand the nature of trade negotiations and the balance of power resulting from the EU’s much greater economic size.
With the EU demanding that the UK scraps it proposed legislation by the end of September, it may be that risks of a no deal outcome increase appreciably in the near term. However, in spite of the understandable concerns about the UK’s new proposed legislation, there have also been some (quieter) soundings of late hinting at some progress in some aspects of the talks. As even a limited trade deal reduces the risk of damage to already fragile economies and ‘no deal’ would be particularly threatening to the UK, our base case is that common sense will eventually prevail and that some possibly eleventh hour compromise will be reached that delivers a limited ‘bare bones’ trade deal between the UK and EU.
US recovery continues
Like the euro area, the US shows signs of a clear recovery in the economy since the trough was reached in the second quarter. Furthermore, while a number of high frequency indicators suggest that the rebound in Q3 GDP will be quite strong, there are still a number of reasons to remain cautious.
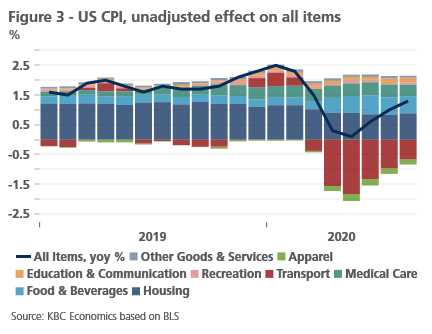
On the positive side, retail trade registered strongly positive year-over-year growth in both June, July and August (5.7%, 5.5% and 5.1% yoy, respectively). High-frequency indicators, like the New York Fed’s Weekly Economic Index, also point to rapidly improving economic conditions. Finally, in contrast to developments in the euro area, US inflation has started to pick up again, suggesting that the negative demand shock caused by the pandemic may be fading. A look at inflation components indeed suggests that the uptick in headline inflation is being led by a recovery in transport prices, as well as somewhat higher food prices (figure 3). Higher transport prices, of course, reflect the recovery in oil prices seen since May, which in turn reflects the rebalancing of the oil market as demand recovers from the Covid-19-induced shock.

Despite these positive signals, we currently maintain our cautious outlook on the US economy, as the strength of the recovery remains questionable particularly as there is uncertainty as to if, when and how fully a further fiscal stimulus might replace income support measures that have now run out. The Dallas Fed Mobility Index, for example, which recovered significantly throughout the second quarter as lockdowns were lifted, has stalled in its recovery at a level that suggests people are still about 35% less mobile than they were in January and February. In line with this, consumer confidence remains at depressed levels, with little sign of a clear improvement. In addition, although the recovery in the US labour market has been relatively strong in recent months, with the unemployment rate falling below 9% in August (from a high of almost 15% in April), underlying trends suggest that some caution is warranted (see Box 2: Positive US labour market data still warrant caution into autumn). Finally, the upcoming US elections in November are an important source of uncertainty, especially given that election results may not be available on the night of the election and given growing concerns that the results of the election could be contested.
Box 2 - Positive US labour market data still warrant caution into autumn
Prior to the onset of the coronavirus pandemic, the US labour market was moving from strength to strength. The continuing decline of the unemployment rate, which until March stood at its lowest reading in 50 years, led policymakers to continuously revise down estimates of the natural rate of unemployment and reevaluate their views on maximum employment. Once the coronavirus hit American shores, the US saw a dramatic increase in its unemployment rate in sharp contrast to its European and Asian counterparts, and the disadvantages of the US’s flexible labour market seemed to outweigh the advantages.
Since the peak of the coronavirus-induced recession in April, US labour market data have surprised on the upside. In August, 1.4mn jobs were created, translating to a cumulative 10.6mn jobs created since May. Additionally, the unemployment rate dropped for the fourth consecutive month to 8.4%. While this is undoubtedly an elevated figure, the downward trajectory signals strong improvement at a time when comparative countries are seeing their unemployment rates creep up.
These headline figures are encouraging, but some of the underlying data might suggest some caution. About 17% of the jobs created in the August payrolls report were for temporary Census workers, and these jobs will be lost in a few months. Job gains in recent months have been strong, but numbers at work still remain 7.6% below their level in February and momentum in job growth seems to be slowing. Moreover, while it is a good sign that the unemployment rate has dipped below double-digits, weekly non-seasonally adjusted initial claims data have increased in the last two weeks. Finally, there is a worrying upward trend in permanent layoffs, which have increased every month since March and now stand at their highest level since March 2014 (figure B2.1). For these reasons, we think a more cautious view on the US labour market is warranted going into the autumn.

China remains a bright spot
The remarkably strong, V-shaped recovery in China is a bright spot in an otherwise relatively negative global economic landscape. Indeed, China is the only major economy that is expected to grow in 2020, with its swift economic turnaround in Q2 offsetting the substantial growth decline the country experienced in Q1. A closer look at the data, however, reveals a ‘two-speed’ economic recovery that is in contrast with developments in Europe and the US. In particular, the Chinese recovery has been led by investment and the industrial sector, rather than by consumption and the services sector. This is evident in the breakdown of Q2 GDP data, where consumption remained fairly weak and subtracted 2.4 percentage-points from year-over-year growth (which amounted to 3.2% yoy). Investment, meanwhile, contributed a positive 5.0 percentage-points to second quarter GDP growth. This two-speed recovery can also be seen in more frequent industrial production and retail trade data. Industrial production has grown in year-over-year terms from April through August, with the pace of growth quickening to 5.6% yoy in August from 4.8% yoy in July. In comparison, retail trade in August posted the first year on year increase of 2020 but was up only 0.5% yoy, following an annual decline in July of 1.1% (figure 4). While a focus on investment and manufacturing is not necessarily negative for China’s outlook, it does undermine the transition to a more service- and consumption-based economy, which China needs in order to maintain sustainably high economic growth in the long run. Evidence of a pick-up on the consumer side of the economy may warrant an upgrade to our relatively conservative 2020 growth forecast of 1.8%, but for now we keep that outlook stable given still substantial uncertainty.

All historical quotes/prices, statistics and charts are up-to-date, up to and including 14 Septemberi 2020, unless otherwise stated. The positions and forecasts provided are those of 14 Septemberi 2020.
