
Economic Perspectives November 2023
Read the full publication below or click here to open the PDF.
- The conflict in the Middle East has rattled energy markets. Gas prices increased by 27% to 45 EUR per MWh last month as supply in Israel’s gas facilities is threatened. The continued risk of strikes in Australian LNG facilities and disruptions on a Finland-Estonia pipeline also put upward pressure on prices. Oil prices initially declined in October as sanctions on Venezuela were expected to ease. They shot back up on 7 October as the Israel-Hamas conflict erupted. Though a contained conflict would have limited impact on oil prices, wider escalation in the region could cause prices to spike. Nonetheless, oil prices still declined by 9.6% in October, reaching 85 USD per barrel.
- Euro area inflation declined significantly, reaching 2.9% in October, down from 4.3% in September, as energy prices fell and food prices stagnated. Core inflation also declined from 4.5% to 4.2% as goods prices fell and service prices increased at a more moderate pace. Given the low October figure and the moderation in oil prices, we downgrade our forecasts from 5.6% to 5.5% for 2023 and from 2.9% to 2.6% in 2024.
- In the US, inflation declined from 3.7% to 3.2% October, thanks to a large drop in energy prices. Core inflation declined from 4.1% to 4.0% as core goods prices declined, while shelter inflation moderated. Service inflation was also subdued and could further moderate as unit labour costs declined last quarter. The increase in consumer inflation expectations is a cause for concern, however. We slightly downgrade our 2023 inflation forecast from 4.2% to 4.1%, while keeping our 2.6% 2024 forecast.
- In line with our expectations, both the ECB and the Fed have kept their policy rates unchanged in their latest policy meetings. Though both central bank chairs hinted at the possibility of further rate hikes, we expect policy rates to have peaked and that they will stay at this elevated level well into 2024. Continued quantitative tightening, along with high spreads and term premia will ensure monetary conditions will remain tight in the coming quarters.
- In the euro area, growth turned negative in Q3 at -0.1%. Among major economies, growth remained healthy in Spain and France, while Italy stagnated and German growth reverted back into negative territory. The coming quarters seem unlikely to bring much relief. Consumer and producer confidence remain weak, while monetary tightening is increasingly impacting lending. The labour market is also starting to ease somewhat. We maintain our 0.5% 2023 growth forecast but downgrade our 2024 forecast by 0.2 percentage points to 0.5%.
- In the US, GDP grew by a very strong 1.2% in Q3, driven by high personal consumption (especially in durable goods), high inventory build-up and elevated government spending. Fixed investment growth was low, however, while net exports even declined. Growth is likely to slow in the coming quarters as excess savings are gradually coming down and student debt repayments restart. Signs of weakening were visible in the latest labor market report which showed a slowdown in job growth and a marginal uptick in unemployment. We now expect strong growth of 2.4% in 2023, but weak growth of 1% in 2024.
- In China, the economic news has been somewhat more positive lately. GDP grew 4.9% over a year ago, putting the 5% target again within reach. The NPC Standing Committee also increased government spending, raising the 2023 deficit by 0.8 percentage points. However, the real estate crisis remains a major drag on growth with US-China decoupling as an added risk. Producer sentiment indicators point to sluggish growth ahead. We upgrade our 2023 growth forecast by 0.2 percentage points to 5.1% but maintain our 4.1% 2024 forecast.
Q3 GDP global figures: two hits and a miss
Q3 GDP figures accentuated the major growth divergences in the global economy. On the positive side, the US economy remains buoyant as GDP increased 1.2% quarter-on-quarter in Q3, thanks to strong consumption, high inventory growth and lavish government spending. China’s GDP also surprised positively. Its GDP grew 4.9% over a year ago, putting the 5% growth within reach. The euro area’s GDP figure disappointed unfortunately, declining -0.1% likely due to lower exports, lacklustre internal demand and inventory growth.
Economic growth figures are likely to converge somewhat in the coming quarters. In the US, continued monetary tightening, the depletion of covid savings and the resumption of student debt repayments are likely to put a drag on growth. In China, the real estate crisis is likely to keep growth subdued. Meanwhile, European growth is likely to remain sluggish, as the energy crisis and monetary tightening extract a toll. Further ahead we expect a gradual economic recovery.
Energy markets rattled by Israel-Hamas conflict
Oil markets were highly volatile last month, reaching 85.6 USD per barrel at the end of October, down 9.6% versus a month ago (see figure 1). Earlier last month, oil prices declined as the US and Venezuela made significant progress on sanctions relief and the dollar strengthened. However, oil prices spiked again as the Israel-Hamas conflict erupted on 7 October. As Israel is not an oil producer, its military operations in Gaza should not disrupt supply if it remains contained. If the conflict were to spread across the region and turn into an Iran-Israel proxy war, however, sanctions on Iranian oil exports are likely to be tightened and oil shipping through the strait of Hormuz could be threatened. Oil prices are thus likely to fluctuate hard in the coming months.
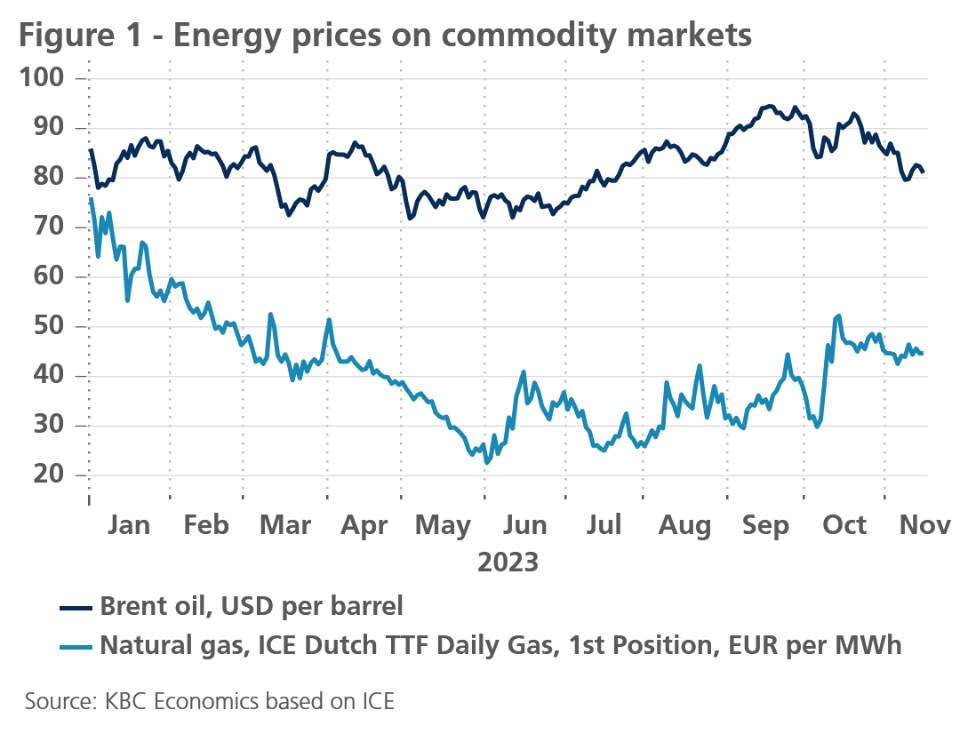
Gas prices have also been impacted by the ongoing conflict. They rose 27% last month to 45 EUR per MWh. Israel has two major gas fields, producing 22 billion cubic meters of gas each year (0.5% of global gas consumption). Furthermore, if the conflict escalates, LNG supplies coming from the wider Middle East (especially from Qatar) could be threatened. Gas prices have also been under pressure due to disruptions on a gas pipeline connecting Finland and Estonia. Furthermore, even though Australian unions at LNG facilities and Chevron management have found an agreement on pay, the threat of further strikes looms large over gas prices. Nonetheless, sky-high EU reserves (at 99%) provide a nice cushion to avoid major gas disruptions this winter.
Looking further ahead, the International Energy Agency (IEA) published its 2023 world energy outlook this month. In the report, it stated that demand for all major fossil fuels (oil, gas and coal) is on track to peak by the end of this decade. Meanwhile, investment in clean energy has risen by 40% since 2020. In its Stated Policies Scenario, it forecasts global temperatures to rise by 2.4 °C (0.1 °C lower than projected last year). This remains much higher than the 1.5 °C global target. The IEA still believes this 1.5 °C target can be reached and that technologies available to reach it are cost-effective. However, reaching this target will still be difficult and requires further global action and sizeable investments.
Latest sharp fall in euro area inflation
In the euro area, inflation fell sharply once again in October to 2.9% from 4.3% in September. The biggest contribution continued to come from energy prices, not only due to the (expected) so-called base effect (prices had risen exceptionally sharply in October of last year making the year-on-year comparison now much smaller), but also due to a further fall in energy prices between October and September 2023. The pace of increase in food prices also slowed sharply (from 8.8% in September to 7.5% in October), while core inflation fell back to a more limited extent (from 4.5% to 4.2%). The cooling of core inflation is proceeding according to expectations, i.e., very gradually, especially as regards services inflation. It will be a long time before the ECB's 2% target comes into sight.
However, the main driver of further developments in headline inflation will continue to be volatile energy prices. With the waning of base effects, the sharply negative contribution of energy price inflation comes to an end. In that respect, October's inflation decline was arguably the last sharp drop in the current disinflation cycle. With core inflation currently higher than headline inflation, even a slight rise in headline inflation becomes likely around the turn of the year.
Simultaneously, the recent decline in oil prices in commodity market suggests that energy prices will continue to exert a predominantly negative impact on inflation in 2024. Therefore, a new but - compared to 2023 - much more moderate inflation decline remains likely during 2024. We have revised our expectations for expected average inflation downwards from 5.6% to 5.5% for 2023 and from 2.9% to 2.6% for 2024.
US inflation makes a bigger drop in October
US inflation declined from 3.7% to 3.2% in October. On a month-on-month basis, prices were unchanged. The annual drop was primarily caused by lower energy prices, which declined 2.5%, thanks to a large fall in gasoline prices. Food prices increased by 0.3% month-on-month, however.
Core inflation declined from 4.1% to 4.0%. The drop can mostly be attributed to a month-on-month drop in goods prices, which remained almost flat versus a year ago. Within core goods, transportation prices declined by 0.4% last month as both new and used vehicle prices dropped. We could see further drops in the latter category as the Manheim Used Vehicle Index declined 2.3% last month and is now at its lowest point since March 2021.
Shelter price inflation also moderated to 0.3% month-on-month. The moderation was mostly caused by a sharp drop in hotel prices. Owner equivalent still increased by a firm 0.4% month-on-month. We could see some moderation in this component as market rents published by Zillow increased by only 0.2% last month and are up only 3% year-on-year.
Services (excluding shelter and energy) increased by 0.25% in October. We could expect some further moderation in this category as well as wage costs are moderating. Hourly wages increased by only 0.2% in October. Furthermore, productivity is picking up again, increasing 1.2% last quarter and 2.4% year-on-year. Unit labour costs thus even decreased by 0.2% last quarter and are now up by only 1.8% year-on-year. On top of that, the reduction in vehicle prices could also end up affecting vehicle insurance prices (with a lag). This component was up 19% year-on-year in October.
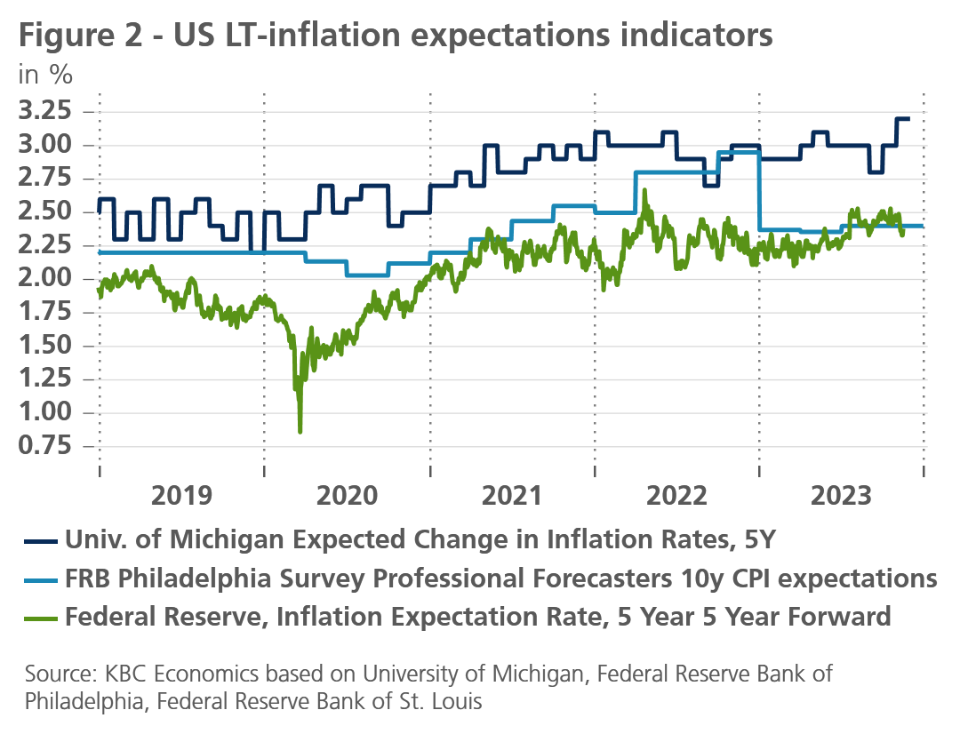
Unfortunately, not everything has been so rosy on the inflation front as US consumers are still expecting inflation to remain elevated in the coming years. According to the Michigan survey, the median one-year-ahead inflation expectation rose from 4.2% in October to 4.4% in November, and the median five-year-ahead measure increased from 3.0% to 3.2%. On the other hand, according to some other metrics, long-term inflation expectations have remained well anchored (see figure 2).
All in all, reflecting the latest inflation development, we slightly downgrade our 2023 inflation forecast from 4.2% to 4.1%, while maintaining our 2.6% 2024 forecast.
Volatile bond yields lower as markets acknowledge end of rate hike cycle
During the past month, US and German 10-year government bond yields fell, mainly driven by the fact that market have priced out another Fed rate hike and started focusing attention on the timing of the start of the next rate cutting cycle. The meagre growth outlook for the euro area and, from the fourth quarter on, also for the US, added to the downward pressure on bond yields.
We confirm our view that although the term premium corrected also downward, its upward trend still remains intact. The reason is that, in our view, the decompression of the term premium in benchmark yields is mainly driven by the ongoing Quantitative Tightening (QT) by both the Fed and the ECB as well as growing supply-demand imbalances in bond markets. We also expect this risk premium to remain elevated because of higher uncertainty about the economic outlook and, in particular, high inflation volatility in the coming quarters. Indeed, the disappearance of strong statistical base effects affecting year-on-year comparisons, that made forecasting headline inflation relatively easier in past quarters, adds to this uncertainty.
On balance, we have lowered our end-of-2023 forecast for both the US and German 10-year bond yields by 20 basis points each, leaving end-of-year yield projections slightly higher than the current level. The yield on US 10-year Treasuries is now expected at 4.60% at the end of 2023, and to gradually decrease to 4.30% by the end of 2024. We expect the 10-year German Bund to reach 2.75% at the end of 2023, falling slightly to 2.60% by the end of 2024.
We confirm our view on 10-year intra-EMU sovereign spreads versus Germany. They are probably close to their final levels, with only limited upward potential. After its previous increase in September and early October, even the Italian spread eased again to about 180 basis points, i.e., below our estimate of a medium-term equilibrium spread for Italy, and well below the implicit market ceiling of 250 basis points. The ECB implicitly indicated that it may consider yields above this level as unjustified which could trigger some sort of ECB intervention. We raised our expectation of the ‘equilibrium’ sovereign spread in Slovakia, however. Given the political and fiscal uncertainty, Slovakia’s sovereign rating may come under pressure and hence cause spreads to rise to 150 basis points by the first quarter of 2024.
The three main supporting factors of our scenario of contained intra-EMU spreads remain valid: the end of the rate tightening cycle by ECB, the existence of the ECB’s Transmission Protection Instrument and the potential use of the flexible reinvestments of maturing assets of the PEPP portfolio. The remaining limited upward potential for sovereign spreads stems from the ongoing liquidity drain caused by the run-off of the ECB’s APP portfolio. In other words, excess liquidity in the system is gradually decreasing. This reduces the ‘search for yield’ pressure exerted by investors on non-benchmark euro-denominated assets and has led in the recent past to a decompression of yield spreads.
As far as monetary policy is concerned, we confirm our view that the ECB deposit rate has reached its peak of this tightening cycle after the September rate hike, which brought the deposit rate to 4%. Given the expected stagnation of the euro area economy well into 2024, a first rate cut by the ECB is likely to happen somewhat sooner than we previously expected. The ECB is likely to start off its rate-cutting cycle with a 25 basis point cut in the third quarter of 2024, followed by two more rate cuts of 25 basis points each in the fourth quarter. This would bring the ECB’s deposit rate to 3.25% by the end of 2024. Meanwhile, the ECB will continue its policy of unwinding its APP portfolio by not reinvesting assets that reach their maturities. This Quantitative Tightening runs in the background and can perfectly well continue when the monetary policy stance will eventually be eased by cuts in the policy rate. Moreover, in line with the ECB’s communication, we expect the ECB to maintain its Pandemic Emergency Purchase Programme (PEPP) portfolio at least until the currently communicated date of end-2024. The reason is the apparent effectiveness of the flexible reinvestment policy of the PEPP portfolio in containing intra-EMU sovereign spreads.
After the Fed kept its policy rate unchanged at 5.375% in November, we confirm our view that this is the peak of its rate cycle as well. This is in line with the current market consensus. In line with the ECB’s timing, the Fed is likely to start their rate cutting cycle from the third quarter of 2024. We continue to expect that the Fed will reach a policy rate of 4.625% by the end of 2024.
Similarly to the ECB’s APP policy, the Fed is expected to continue its balance sheet run-off (QT) at the current pace of about 95 bn USD per month (on average 60 bn USD of Treasuries and 35 bn of Mortgage Backed Securities). As is the case for the ECB’s APP, the Fed’s QT is likely to continue after the start of the easing cycle of its policy rates.
The stabilisation of short-term interest rate differentials has led to a depreciation of the US dollar to 1.07 US dollars per euro. The US dollar is likely to remain around the current level until the first quarter of 2024. From the second quarter of 2024 on, when the trough of the business cycle is gradually being passed, the euro is likely to regain ground against the US dollar again. This view remains based on our fundamental assessment that the US dollar is overvalued against the euro at its current exchange rate.
Eurozone economy shrinks slightly
According to Eurostat's preliminary flash estimate, euro area real GDP contracted by 0.1% in the third quarter of 2023 compared to the previous quarter. The contraction was mainly situated in the German economy (also -0.1%), as well as in the Irish and Austrian ones, which declined quite sharply (-1.8% in Ireland and -0.6% in Austria). Among the major eurozone countries, Spain in particular (+0.5%) recorded relatively strong growth, while France's growth was a modest 0.1% and Italy's economy took a break. Not much detail is yet available on the composition of growth, but the scarce information suggests that mainly household consumption explains the diverging growth dynamics between countries. In France and especially in Spain, it made a positive growth contribution, while in Germany and presumably also in the other (medium-)large countries, it did not contribute positively or did so to a much smaller degree.
At the start of the fourth quarter, confidence indicators suggested little imminent improvement. The Composite Purchasing Managers' Index (PMI) fell again in October, following a slight improvement in September. At 46.5, it is now at its lowest level since November 2020, significantly below the threshold of 50, which is associated with the difference between economic expansion and contraction. According to this indicator, confidence fell in October in both manufacturing and construction and services sectors. However, the loss of confidence is not reflected in the European Commission (EC) surveys, which include a broader group of companies. But the slight improvement in confidence according to the EC indicator - though not in industry - does not counter the fact that even this indicator still indicates very weak confidence. Only in the service sectors, according to this indicator, is there improvement in demand expected in the coming months.
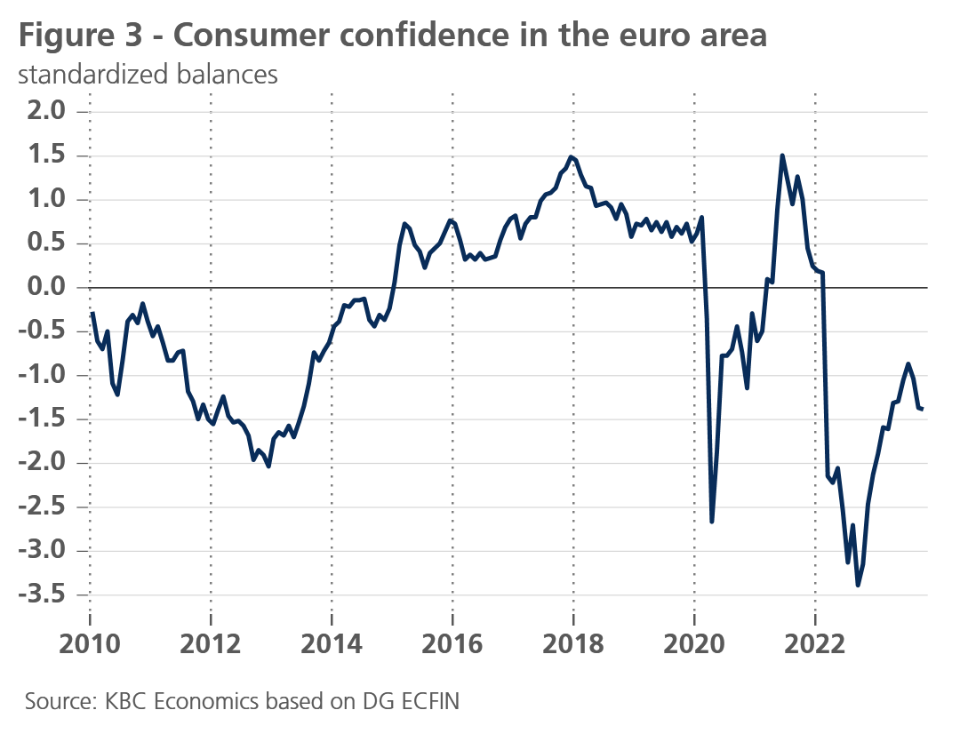
The latter would also be the case in the retail sector, although consumers do not share this optimism. Indeed, consumer confidence still weakened slightly in October, following sharp declines in previous months. The steady improvement since autumn 2022 has thus reversed (see figure 3). Consumers' future expectations regarding major purchases, the construction or purchase of a home or home improvement works all deteriorated slightly.
Apparently, consumer confidence is less firm than what might be expected based on the historically low unemployment rate. Possibly, consumers feel that the labour market is slowing down somewhat. The year-on-year decline in the number of unemployed came to an end in September, while the - as noted - still historically low unemployment rate rose slightly. In addition, the rise in interest rates spurred by tighter ECB policy since summer 2022 is also playing a role. The ECB's Bank Lending Survey, organised in the second half of September, shows that interest rate levels are a major factor in the decline in perceived demand for consumer credit, home loans and also business loans.
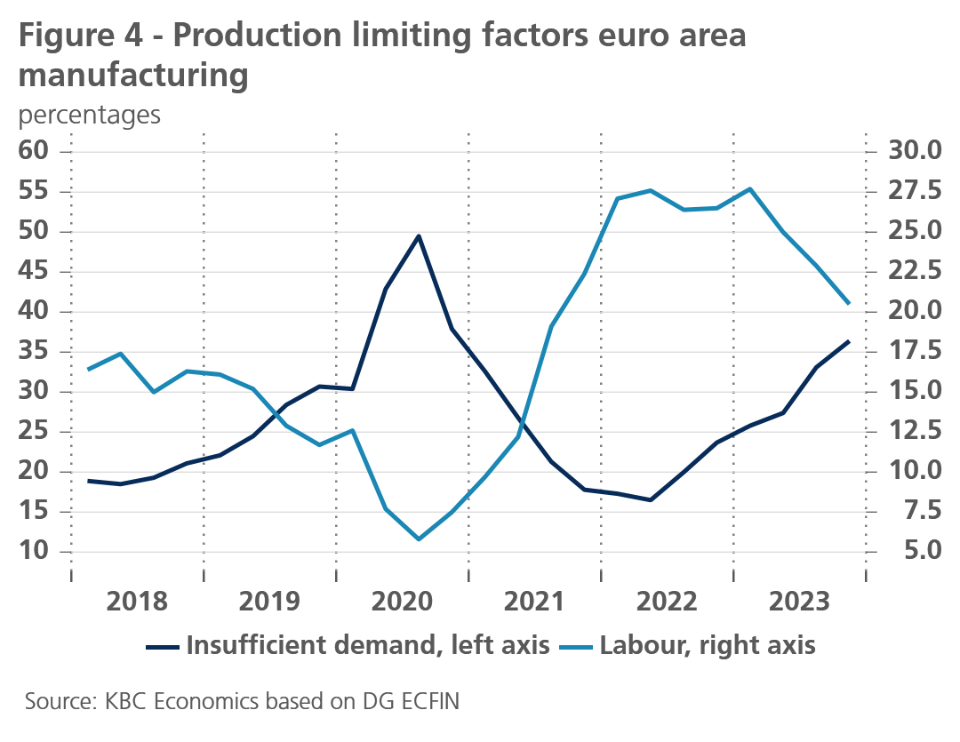
Meanwhile, especially in manufacturing, the employment outlook is worsening, and labour shortages are becoming less of a limiting factor of production, especially compared to perceived insufficient demand (see figure 4). This is consistent with the weakness in industrial output, especially in Germany. Manufacturing output there in the third quarter was more than 2% lower than in the second quarter, and compared with the previous year, the drop in September was as much as 3.5%. This is not only due to a new downturn in the automotive industry, where the recovery between late 2021 and mid-2023 has now come to a halt. In many other sectors too, production is falling or, at best, stagnating.
Against this background, we have slightly revised downwards our expectations for economic growth in 2024. A further contraction of the eurozone economy in the last quarter of 2023 and early 2024 cannot be ruled out, but in our outlook, we assume that the labour market will nevertheless remain sufficiently resilient to allow consumers to convert their recently improved purchasing power into consumption. Business investment is also likely to remain resilient, thanks in part to the Next Generation EU funds, which could counterbalance the underperforming global trade and the expected - though rather limited - fiscal consolidation in 2024.
On balance, we maintain our expectation of economic stagnation in the fourth quarter of 2023 but have slightly lowered our expectations for recovery in 2024. Annual average real GDP growth in the euro area would then be 0.5% in 2023 (unchanged outlook), but also only 0.5% in 2024 (versus the previous expectation of 0.7%). Somewhat surprisingly, the expected contraction of the German economy (-0.1%) in 2023 is likely to be somewhat smaller than previously expected (-0.3%). However, this is only due to the upward revision of GDP figures for the first half of 2023. The downward revision to the forecast for the strength of the recovery in 2024, is expected to leave the average growth of the German economy stranded at 0.3% (instead of the earlier estimate of 0.4%).
The US economy is still booming
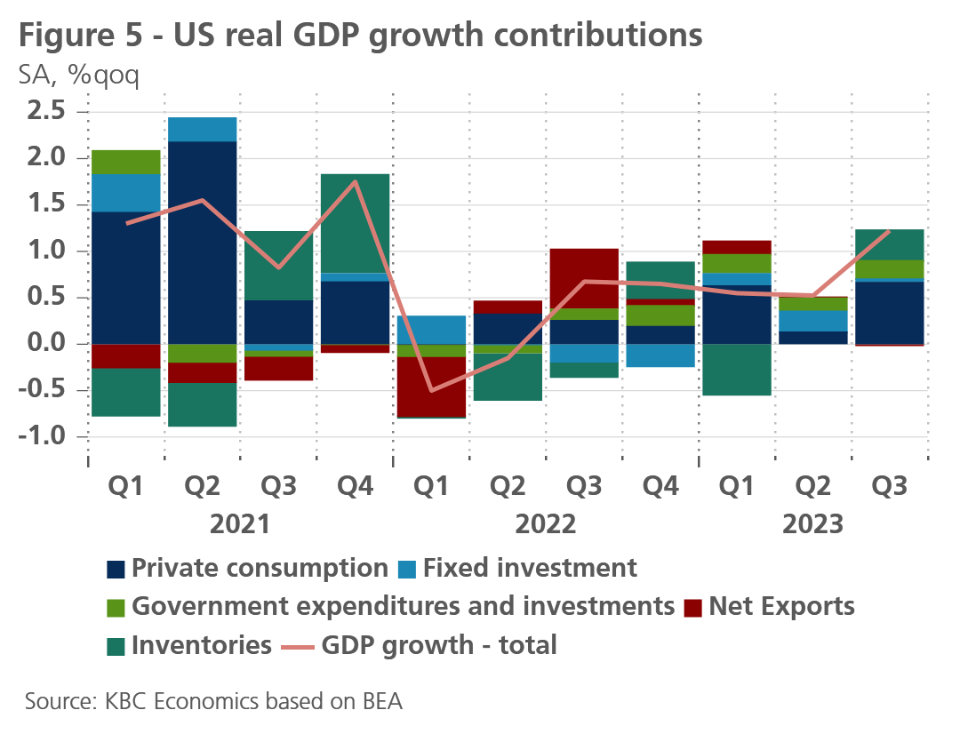
In the US, GDP grew by a very strong 1.2% in Q3 (see figure 5). Personal consumption contributed to more than half of Q3 GDP growth (0.67%). The surge in durable goods consumption was especially notable (1.9% quarter-on-quarter). Inventories also made a major contribution to US growth (0.33%), a performance unlikely to be repeated in the next quarters. Government consumption also made a strong 0.20% contribution, thanks in large part to higher national defense spending. Residential investments also made a positive contribution (0.04%) for the first time since Q1 2021. Non-residential investments remained flat, however, a sign that higher rates are starting to pull the brakes on growth in interest-rate sensitive sectors. Equipment spending, a leading indicator, even declined. A slowdown among major trading partners and a stronger dollar probably hurt the US trade balance, as net exports provided a negative contribution (-0.02%).
The high Q3 growth figures are unlikely to be repeated from Q4 onwards. Real disposable income declined for the third month in a row. To maintain these high levels of consumption, households are drawing down their savings. Personal savings reached 3.4% in September, 0.6 percentage points lower than in August. Beside a negative base effect, the resumption of student loan debt repayments will also be a drag on spending.
Furthermore, though the Fed kept its policy rate stable, the rise in longer-term (real) Treasury yields is effectively tightening monetary conditions.
There were some good news though. A government shutdown has also been averted as the House passed a bipartisan bill to extend government funding through early 2024. Another positive development was the end of the United Autoworkers strike, as unions and carmakers reached a tentative agreement on pay and working conditions. Nonetheless, the six-week strike will still have had a negative impact on Q4 growth.
The imminent growth weakening was also evident in the October labour market report, where non-farm payrolls increased by a moderate 150k. The unemployment rate followed continuing claims higher as it ticked up from 3.8% to 3.9%, while the participation rate ticked down from 62.8% to 62.7%. The number of people working part-time for economic reasons increased, while average hours worked ticked down from 34.4 to 34.3 hours per week.
All in all, given higher than expected Q3 growth figures, we upgraded both our 2023 and 2024 forecast by 0.1 percentage points to 2.4% and 1%, respectively. Hence, we continue to assume that tighter financial conditions represented by very high real interest rates will bring GDP growth below its long-term trend in 2024.
China on course to reach the CCP growth target
China’s Q3 GDP figures surprised to the upside at 4.9% year-on-year, setting the economy up to reach (and slightly surpass) the government’s 5.0% growth target in 2023. Relative to 2022’s poor growth outturn (of 3.0% due in large part to zero-covid), a rebound of 5.0% wasn’t very ambitious, so reaching the target doesn’t reveal much about the overall health of the Chinese economy. In general, signs still point to sluggish economic developments. The Q3 GDP figure was also supported by a negative GDP deflator, meaning nominal GDP was even weaker at only 3.5% year-on-year. This compares to an average of nearly 9% year-on-year between 2015-2019, suggesting growth dynamics remain relatively weak. More recent data also point to sluggish growth, with the S&P service sector PMI declining from 51.7 to 50.6. in October, and the S&P manufacturing PMI declining from 50.6 to 49.5. We have therefore slightly downgraded our growth outlook for the fourth quarter, which together with the positive Q3 surprise, leads to an upward revision of 2023 annual GDP growth from 4.9% to 5.1%. Our forecast for 2024 remains unchanged.
All historical quotes/prices, statistics and charts are up-to-date, through November 13, 2023, unless otherwise noted. Positions and forecasts provided are those as of Nov. 13, 2023.