

It’s not all sunshine and roses on the European labour market

- Economic growth, work volume and productivity
- Labour volume and employment
- Towards a larger labour supply
- Jobs and growth
Read the full publication below or click here to open the PDF file.
In recent years, the economic recovery has significantly reduced unemployment in the euro area. The unemployment rate has fallen from a peak of 12.1% in the first half of 2013 to 8.1% in October 2018 (Figure A).
Figure A - Unemployment rate in the euro area (Percentage of the labour force)
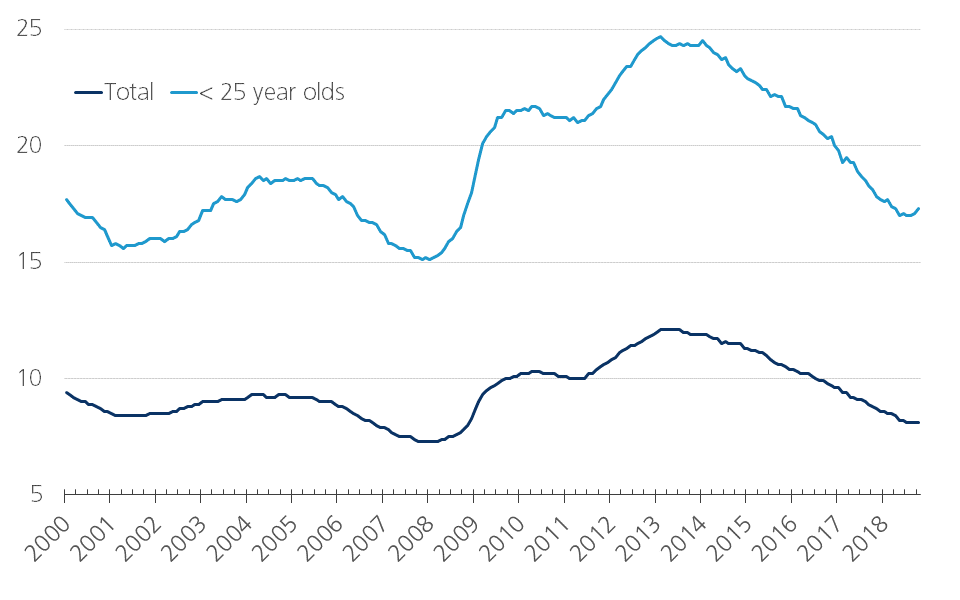
This brings it close to the rate of 7.3% reached in the autumn of 2008, the series’ previous low point. There are major differences between the euro area countries. In some countries (Germany, Belgium, Slovakia), the unemployment rate is at its lowest level since the launch of the euro in 1999 (Figure B).
Figure B - Unemployment rate (Percentage of the labour force)
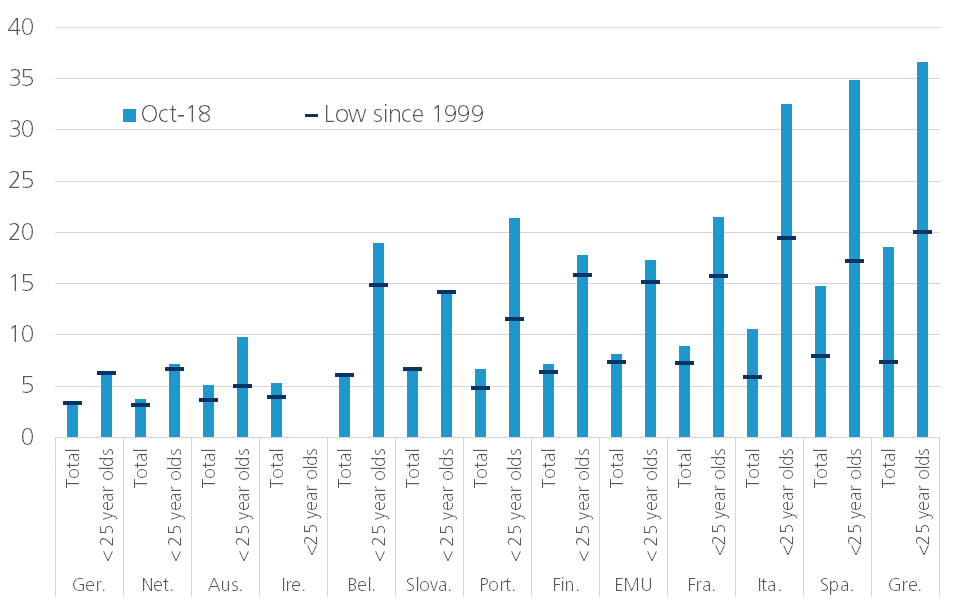
In other countries (the Netherlands, Austria, Ireland, Finland) it is very close to this level. In the southern European euro area countries, there is usually still a significant gap between the current level and the historical low. The unemployment rate among young people (< 25 year olds) in the euro zone is still more than twice as high. In Italy, Spain and Greece, about one young person in three is still unemployed on the labour market.
At the same time, there are more and more signals of labour shortages. Surveys on business confidence show that this tightness is now the greatest barrier to economic activity on record (European Commission - Figure C).
Figure C - Labour shortage as a production limiting factorr (Percentage of firms)
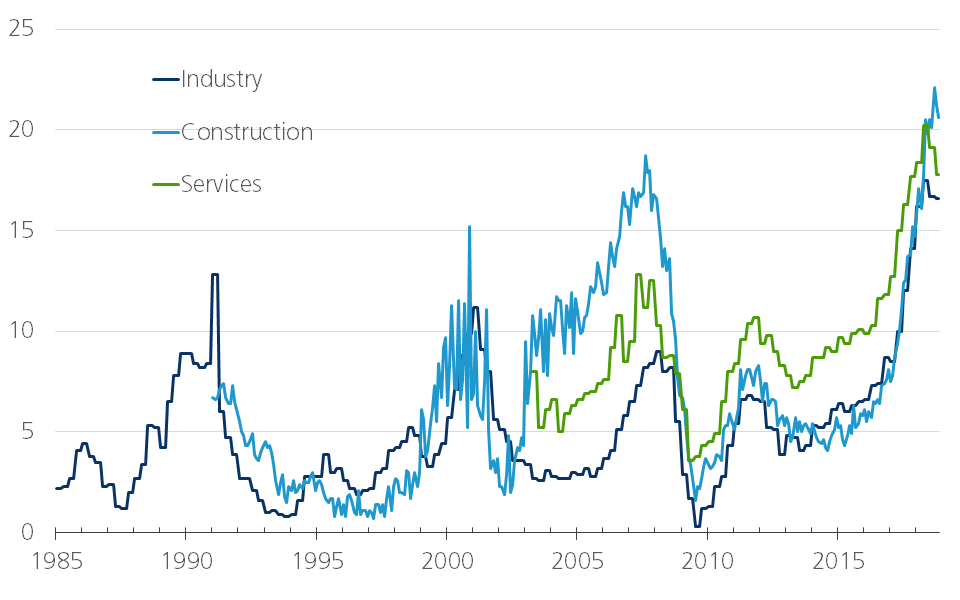
The sharp increase in the number of job vacancies in 2017 also indicated increasing labour shortages. In this respect, Belgium is among the leaders in the EU.
In this article, we will zoom in on the relationship between economic growth and some developments on the labour market in the largest countries of the euro area over the past 15 years. We can classify this period into three sub-periods in an economically meaningful way: 1) the period of economic growth after the "dotcom" crisis and before the outbreak of the global financial crisis (2003-2007); 2) the period of the financial crisis and the debt crisis in the euro area (2008-2012); and 3) the period of renewed albeit uneven economic growth after the euro crisis (2013-2017). We are not looking here at general developments in the unemployment rate, but rather at the interaction between labour volume, labour productivity and economic growth.
At its most basic level, economic growth can be described as the result of more or less hours worked (the volume of work) and higher or lower production (here measured by real GDP) per hour worked. The first factor links to the labour market; the second is a measure of the change in labour productivity. Figure D shows for each of the periods mentioned the contribution of both factors to real GDP growth in the euro area and its six largest economies.
Figure D - Real GDP growth, work volume and labour productivity (Annual percentage change)

The figure shows that real GDP growth in the euro area in the recent recovery period was significantly lower than during the 2003-2007 growth period: 1.5% per year on average in 2013-2017 compared to 2.2% per year on average in 2003-2007. This slowdown has occurred in all countries except Germany, where growth in the recent period has been slightly higher than ten years before.
For all countries shown, labour productivity makes a positive contribution to real GDP growth in almost every sub-period. However, this contribution varies from one period to another and there are also large differences between countries. For the euro area as a whole, France, Italy and Spain, annual average productivity growth in recent recovery years was broadly similar to the growth in 2003-2007. In Germany, the Netherlands and Belgium, it has eased considerably. Most prominently, labour productivity in Italy has contributed hardly anything to real GDP growth in the last 15 years. The stagnation in productivity is an important explanation for Italy's very low economic growth.
Figure D also illustrates the large impact of fluctuations in economic growth on working hours and thus on the labour market. In most euro area countries, labour volume fluctuations were higher than labour productivity fluctuations. The fluctuation was highest in Spain. The economic boom before the crisis years was mainly the result of a sharp increase in the use of extra labour. During the crisis years, this was emitted en masse. In Italy there was a similar development, but at a much more moderate pace. During this current recovery, the Spanish economy is succeeding in redeploying its workers. Moreover, this is accompanied by slightly stronger productivity growth than in the pre-crisis years. This points to a structural strengthening of the Spanish economy and explains why Spain currently has the strongest growth rates in the eurozone. Italy, on the other hand, has not been able to boost productivity growth significantly, while the integration of labour into the economy has been rocky at best. This explains why the country remains at the back of the growth pack and illustrates the severe structural challenges it faces.
Germany and France also have remarkably different growth rates in the volume of labour. In the pre-crisis years, growth in Germany was significantly lower than in France, which at the time was about the average of the eurozone, but in the post-crisis years this was the other way round. Labour volume growth in France more than halved, while in Germany it more than doubled. So there is still work to be done in France to create more employment. Labour market reforms are still high on the political agenda today, while Germany is now reaping the benefits of the reforms implemented at the beginning of this century.
Belgium is the only country where the volume of work continued to increase significantly during the crisis period 2008-2012. This fully explains why economic growth remained relatively strong at that time compared to the other euro countries. Productivity growth had come to a complete standstill during this period. The relative stability of the growth in the volume of labour in Belgium is rather exceptional and the result of the policy pursued at the time.
The volume of work does not immediately say anything about the number of people who work. We can map this connection by breaking down the volume of work into the number of people in work (employment) and the average number of hours worked per worker (working time). Figure E illustrates that the increase in the volume of labour in the euro zone over the period 2003-2007 was almost entirely due to employment growth.
Figure E - Employment and working time (Annual percentage change)
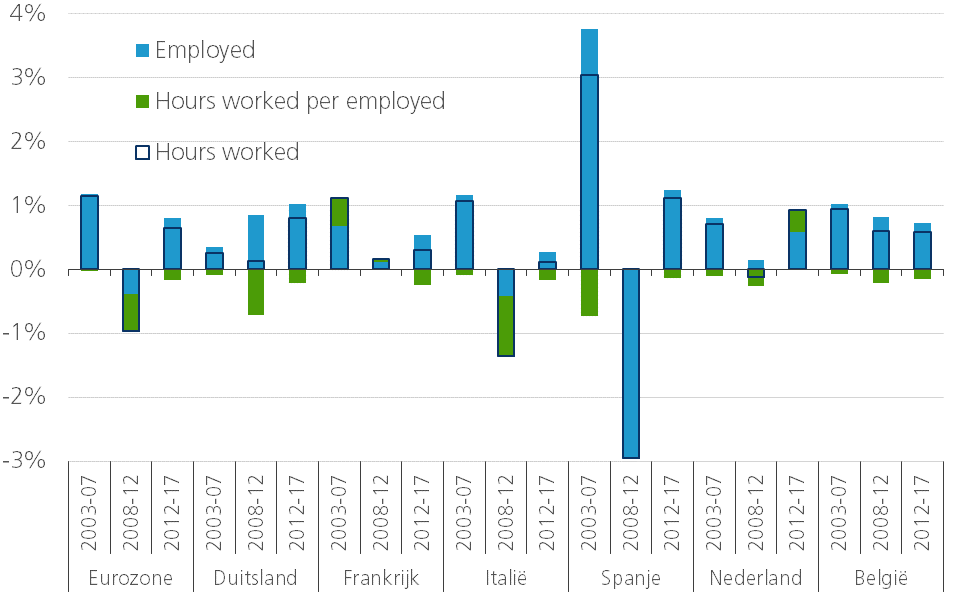
In addition to job losses during the crisis years, the average working time per worker was significantly reduced. The latter trend has not yet come to a complete halt in the recent recovery period. As a result, the increase in employment was slightly higher than the increase in the volume of work.
Changes in the average number of hours worked per worker may be due to various factors, such as changes in conventional full-time working hours, overtime or the share of part-time work. These changes are in turn explained by the economic situation and by structural, socio-economic changes, which reflect a social preference. In the euro zone, the share of part-time work in total employment rose from almost 16% in 2002 to over 22% in 2017 (Figure F).
Figure F - Part-time work (Percentage of total employment)
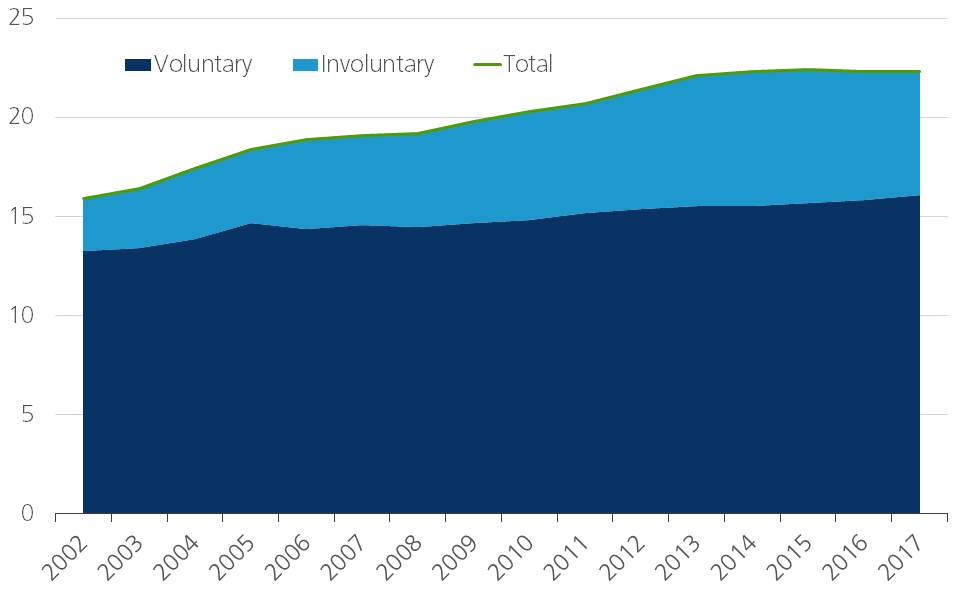
However, most of the increase took place between 2003 and 2013. In particular, involuntary part-time work (people working part-time because they cannot find a full-time job) increased strongly. It is striking that this was also the case during the period of relatively strong economic growth in 2003-2007. In contrast to that period, involuntary part-time work did fall during the recent boom period. This can also be interpreted as another sign that the labour market is becoming tighter. However, the number of people working part-time on a voluntary basis continues to rise slightly. The increase in part-time work occurs almost exclusively among higher-skilled workers, especially - but not exclusively - among women. The share of low-skilled part-time workers, on the other hand, is steadily declining, for both men and women.
It is striking that the increase in employment in Germany is much stronger than that in the volume of work. Especially during the crisis period, but also in the recent recovery period, the average working time per person employed in Germany has been reduced rather sharply. According to this measure, average working time in Germany is the lowest of all countries shown. In 2017, it was more than 13% below the euro area average and even more than 20% below the Italian average, which is the highest of the countries shown. The development in Germany reflects, among other things, the trade union preference for working time reduction in social negotiations and the creation of so-called mini-jobs since the labour market reforms of the early 2000s. This has reinforced the fall in the German unemployment rate to its current historical low.
In Belgium, too, employment growth exceeded the growth in the number of working hours, thus reducing the average working time per worker. But this trend was less pronounced than in Germany, especially during the crisis years. Historically, the average number of working hours per person employed in Belgium is slightly below the average for the euro area. The gap has narrowed slightly over the past 15 years, as the number of hours worked per worker fell slightly less in Belgium than in the euro area. However, Belgium distinguishes itself from the other euro countries mainly by the relatively constant, relatively strong growth in the number of people in work. Over the entire period 2003-2017, Belgium has been in the lead: 13.6% compared to 8.3% for the euro zone and 11.7% in Germany. The strongest growth was in public services and subsidised services (administration, defence, education, health and care). If we exclude employment growth in these sectors, it is not Belgium but Germany that is in the lead: 9.6% (Germany) versus 9.0% (Belgium). It is also striking that in the recent period, the Netherlands is the only euro country among the selected countries, where the increase in employment is accompanied by an increase in the average number of hours worked per worker. On the other hand, it is at the second lowest level in the euro zone, after Germany.
The scarcity of the labour market indicates that an increase in labour supply is necessary to maintain and, a fortiori, strengthen economic growth. This can be done in various ways. In theory, working time per worker can be increased. However, this goes against society's preference. The steady slight increase in the share of voluntary part-time work suggests that a growing proportion of workers prefer to reduce their working hours. In any case, recent trends show that only in the Netherlands the average number of hours worked per worker has increased.
Increasing the number of people in work is another option for increasing the labour supply. Government policy is strongly committed to this. For example, the 'Europe 2020' strategy aims to achieve an employment rate (the proportion of the working population in a given population group) of 75% for the EU population aged 20-64 by 2020. In mid-2018, the figure was 73.2%, but several countries score significantly lower. Clearly, there is still work to be done in this area - in the context of an ageing population, even for a wider age group than currently targeted by the policy.
Germany is often cited as a shining example in this context. The strong increase in employment in the German economy boosted the employment rate of 15-64 year olds from 65.4% in 2002 to 75.2% in 2017 (Figure G).
Figure G - Employment rate (Percentage of 15 to 64 year olds)
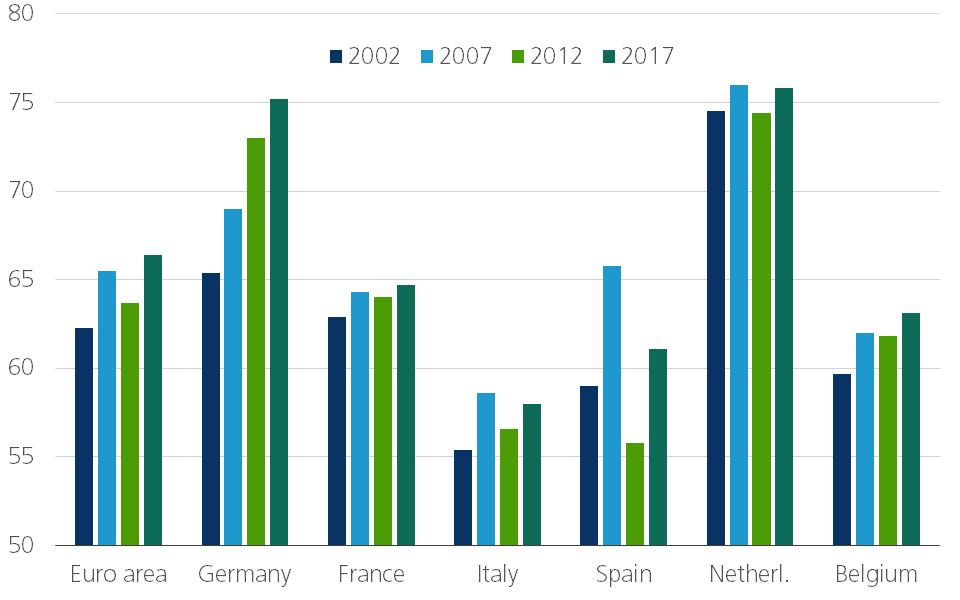
However, this increase was also facilitated by the shrinkage of the population aged 15 to 64. Since the employment rate represents the ratio between the working population and the total population in a given age group, this ratio may also increase when the population shrinks. In Germany, the overall decrease over the period considered was 2.3% (Figure H).
Figure H - 15 to 64 year olds (Annual percentage change)
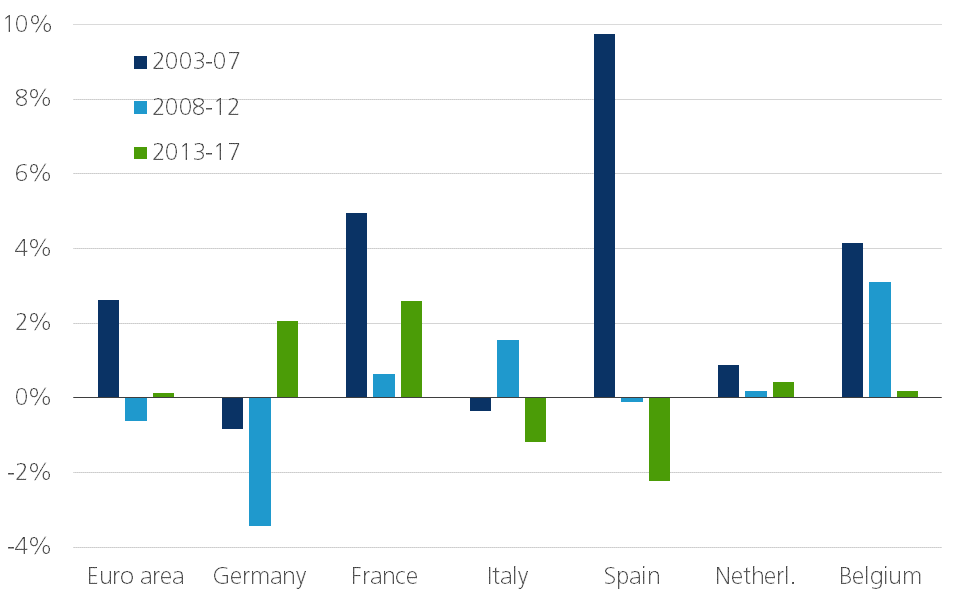
In Belgium, on the other hand, this population group increased by more than 7.5% during this period. This increase occurred mainly in 2003-2013; since then it has largely stagnated. Nevertheless, the strong population growth explains why the stronger employment growth in Belgium caused an increase in the employment rate much less than in Germany.
Obviously, an increase in the employment rate only increases economic growth if it is the result of an increase in employment. The German example illustrates that this is only partially the case with a shrinking population. Figure H also shows that demography varies greatly over time and between countries. In addition to natural factors such as births and deaths, migration flows also play a role. It makes clear that the assessment of the performance of the labour market and labour market policy must take a broader view than the development of the employment rate.
Not only the size of the labour supply is important, but increasingly also its quality. Figure I illustrates that in the past 15 years, low-skilled jobs have systematically been lost, while jobs for the higher educated have continued to increase.
Figure I - Employment by level of education (Annual percentage change)
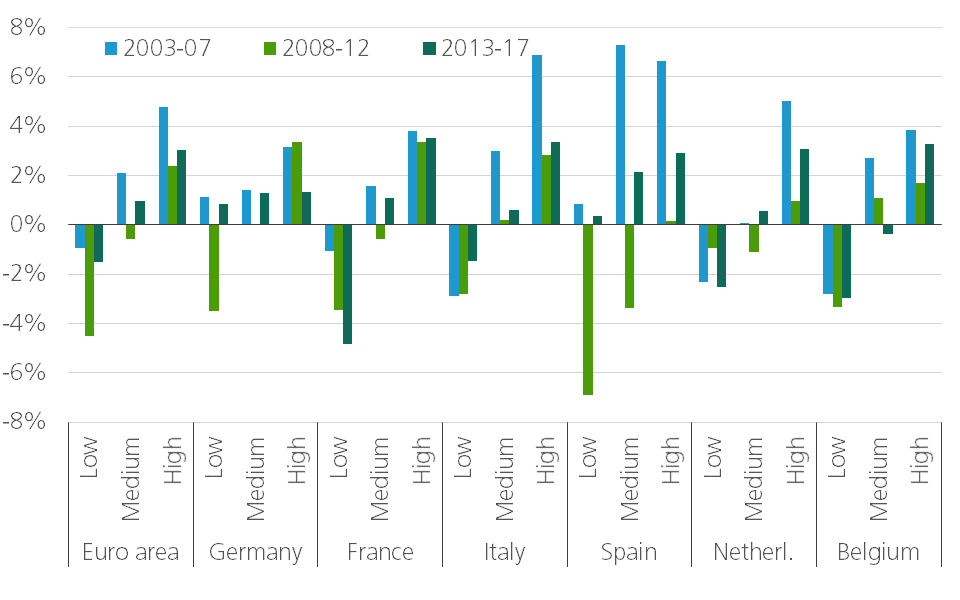
The disappearance of low-skilled jobs was particularly dramatic during the 2008-12 crisis period, while the deployment of highly-skilled workers continued to grow steadily even then and the deployment of medium-skilled workers, depending on the country, continued to decline or only to a limited extent.
This is also reflected in the unemployment rates. During the crisis years, the unemployment rate for the low-skilled in the euro area almost doubled from around 11% at the beginning of 2008 to just under 22% in 2013 (Figure J).
Figure J - Unemployment rate by level of education (As a percentage of the labour force, euro area)

By mid-2018, it was still over 15%. The unemployment rate of highly skilled workers also doubled during the crisis period, but is structurally much lower and has almost returned to the low point of early 2018. That is less than 5%.
It is clear that the signs of scarcity on the labour market mainly reflect a shortage of skilled workers. Remedying this problem is an important policy priority. But given the high unemployment rate among the low-skilled, labour market reforms must also simultaneously promote their integration into the economy. It is only in Germany and Spain that the economic recovery of recent years has also led to - modest - employment growth for this group.
The fall in the overall unemployment rate in the euro area is an encouraging development. However, despite stronger signs of labour market tightness, the goal of full employment is still far from being achieved. It is not all a sunshine and roses on the European labour market. Labour market policy still faces major challenges. These vary greatly from country to country, as have the developments on the labour market over the past 15 years. This had to do, among other things, with different demographic circumstances, social preferences and the policy pursued. At the same time, it is clear that job creation and economic growth are inextricably linked. To create jobs, growth is necessary; but without an appropriate labour supply, economic growth is made very difficult.