Regional economic growth in Belgium
Uneven regional recovery in 2021 from the 2020 Covid-19 trough

- 1. Introduction
- 2. Regional growth before Covid and in 2020
- 3. Regional business cycle indicators in 2021
- 4. Estimating regional growth in 2021
Read the publication below or click here to open PDF.
Abstract
Following the virtual disappearance between 2000 and 2008 of the differences in economic growth rates between the three regions in Belgium, Flanders regained its post-war systematic growth advantage over Wallonia and Brussels after 2008. In the period from the financial crisis to the pandemic crisis, between 2008 and 2020, real gross regional product in Flanders increased by an average of 0.96% per year, compared to 0.75% per year in Wallonia and barely 0.21% per year in Brussels. In 2020, the latest available figure recently published by the National Accounts Institute (NAI), the pandemic caused economic activity to contract more in Wallonia (-5.8%) than in Flanders (-5.1%) and Brussels (-5.2%). For 2021, we still lack hard GDP figures on the strength of the economic recovery in the three regions from the Covid-19 trough. In this research report, we try to shed some light on this, after first briefly explaining the relative growth course in the years before Covid-19 and in 2020. In order to estimate the relative strength of the growth recovery in 2021, we use regional business cycle and labour market indicators, which are available for 2021 (on a monthly basis).
Based on the 6.1% real GDP growth realised by Belgium as a whole in 2021, we think that economic growth in Flanders and Wallonia will have been 'a few' tenths of a percentage point above and below that, respectively. A more precise, numerical estimate of regional growth in 2021 remains difficult. Especially for Brussels, where growth has been not only relatively low but also more volatile since 2008, the estimate is difficult. However, based solely on confidence indicators, it seems that, as in Wallonia, growth in Brussels in 2021 has been below the national average. If our rough estimate for 2021 is confirmed, and taking into account the already known regional growth figures for 2020, the Walloon economy would still not have recovered from the Covid blow of 2020 in 2021. The Brussels economy, which like the Flemish economy suffered a smaller blow in 2020, should have reached the 2019 level again by 2021, with the Flemish economy already some 1% above. For final results, we will have to wait until early 2023, when the NAI will publish 2021 figures.
1. Introduction
At the end of January, the National Accounts Institute (NAI) published new figures on the Regional Accounts in Belgium. These provide a picture of how the three Belgian regions - Flanders, Wallonia and Brussels - have performed relative to each other in terms of economic growth, or the growth of their 'real gross regional product'. These regional growth figures are only available on an annual basis (so no quarterly figures) and lag behind the publication of the national GDP figures. For Belgium as a whole, we now know that, with real GDP growth of 6.1% in 2021, the economy recovered strongly from the Covid-19 recession (-5.7%) of 2020. For the three regions, the figures only run as far as 2020 and it is as yet unclear with what force economic activity climbed out of the Covid trough.
However, based on the already known national growth rate and a series of regionally available business cycle and labour market indicators for 2021, we can attempt to make a rough estimate of regional growth last year. In order to place our estimated regional economic performance in 2021 in a somewhat broader perspective, we first discuss in section 2 of this research report the historical relative growth course of Flanders, Wallonia and Brussels in the years prior to the Covid-19 crisis and in 2020. The NAI provides the regional growth figures for the period 2003-2020 according to the ESA 2010 standard (European System of Accounts). As was the case with previous publications of the data, the latest publication by the NAI partially revised the historical growth rates relating to this period. The older growth figures before 2003, which we show in some figures and which are based on previous systems of accounts, come from the database of KBC Economics. In section 3 of the report, we discuss the course of the available regional business cycle and labour market indicators in 2021. This analysis allows us, in section 4, to make a first (very rough) estimate of how strong the growth recovery has been in the three regions in 2021.
2. Regional growth before Covid and in 2020
Flanders regains growth lead...
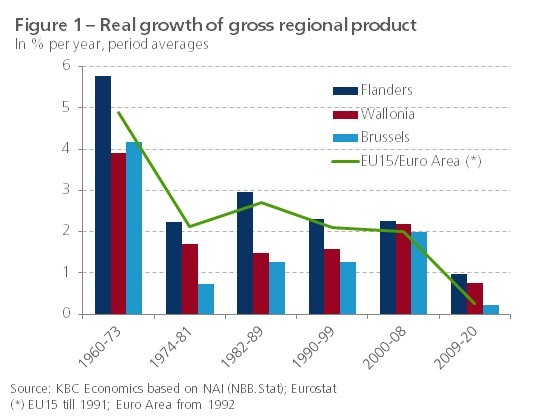
In the period since the financial crisis, between 2008 and 2020, the gross regional product in Flanders, Wallonia and Brussels grew in real terms by an average of 0.96%, 0.75% and 0.21% per year respectively. After the regional growth differences in Belgium had become rather small in the period 2000-2008, the systematic growth advantage that Flanders enjoyed before 2000 over the other two regions (especially Brussels) thus returned after 2008 (figure 1).
The 2009 Great Recession hit Wallonia somewhat harder than Flanders. The region initially recovered relatively strongly in 2010, but then stabilised during the European sovereign debt crisis in 2012-2013, while Flanders continued to grow (figure 2). Until 2016, Walloon growth remained relatively weak compared to Flanders, but in the two years preceding the pandemic, Wallonia did grow noticeably faster than Flanders. Just as during the two previous crises (Great Recession and European debt crisis), the Walloon economy was hit harder (-5.8%) than the Flemish (-5.1%) during the Covid-19 crisis. This is surprising because international trade fell sharply each time and Flanders, as a more open economy, is traditionally more sensitive to this than Wallonia. Industry was hit less hard in Wallonia in 2020. The fact that the Walloon economy was relatively strongly affected by the pandemic was mainly due to the greater impact on trade (wholesale and retail) and catering (accommodation and food service activities), and on certain services (figure 3). Nevertheless, the 2020 GDP contraction in Wallonia was also smaller than that of the euro area (-6.3%).
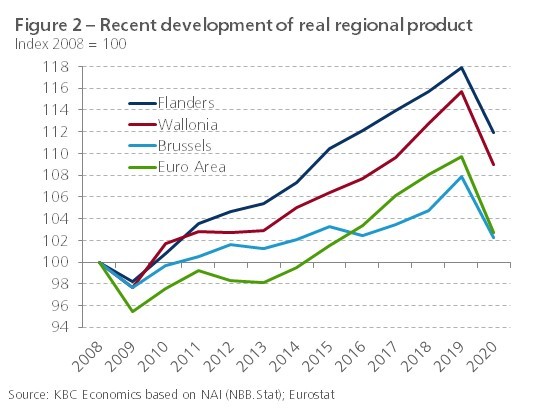
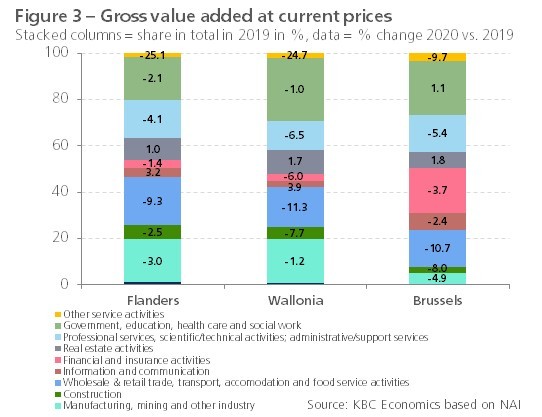
The Brussels economy was also affected somewhat more than the Flemish economy by the Great Recession of 2009. The most striking thing about Brussels is the much lower average growth than Flanders and Wallonia in the years 2010-2018 (figure 2). Part of the explanation lies in the terrorist attacks of 22 March 2016 at the airport in Zaventem and in the metro in Brussels. These hit the hospitality, retail, and leisure sectors hard at the time, resulting in negative growth in the Brussels economy that year. In 2019, for the first time since 2012, economic growth in Brussels (2.9%) was stronger than in the other two regions (1.9% in Flanders and 2.6% in Wallonia). This relatively strong growth was largely due to the strong dynamics of activity in financial services. Even during the pandemic in 2020, activity fell less in Brussels (-5.2%) than in Wallonia (-5.8%), as it did in Flanders (-5.1%). The stronghold in Brussels was the public sector (in the broad sense), which in contrast to Flanders and Wallonia continued to grow in 2020 (figure 3).
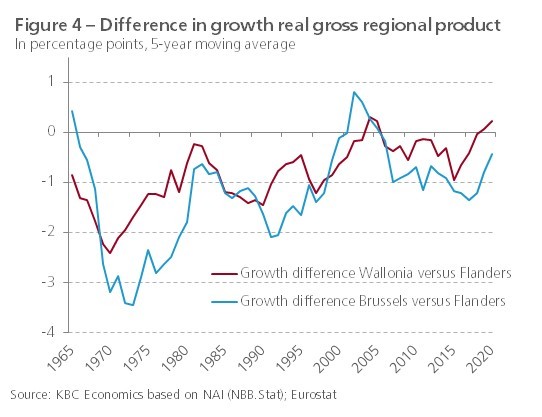
Figure 4 shows the growth differences of Flanders with Wallonia and Brussels respectively per year, calculated as the 5-year moving average in order to eliminate the high volatility in the series. Viewed in this way, the growth differential of Flanders with Wallonia and especially Brussels deepened again after 2005. But in more recent years, that gap seems to be narrowing again.
...due to higher employment growth
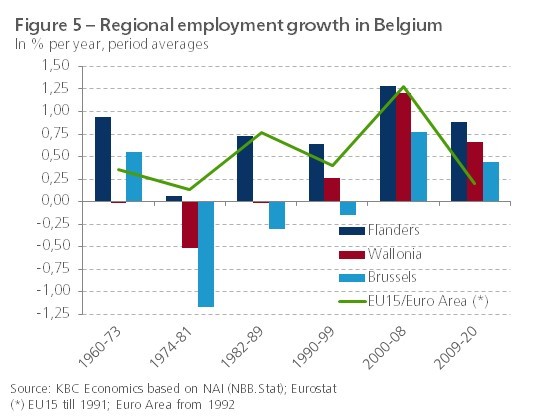
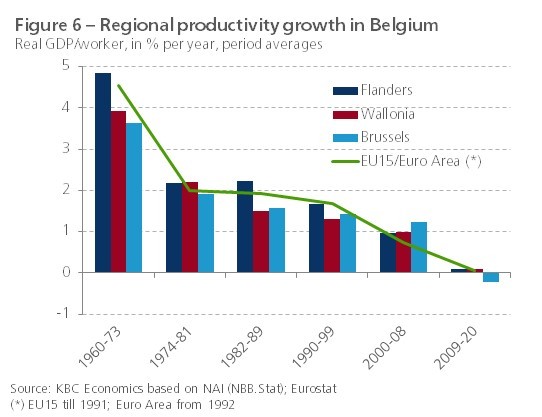
Simply put, economic growth is the sum of employment growth and productivity growth. The fact that Wallonia and especially Brussels again grew more slowly than Flanders on average in 2009-2020 was primarily due to the lower growth in employment. During this period, employment growth averaged 0.69% per year in Wallonia and 0.44% per year in Brussels, which was lower than in Flanders (0.88% per year) (figure 5). In terms of employment growth, however, all three Belgian regions scored better than the euro area. It illustrates that GDP growth over the past decade has been labour intensive throughout Belgium, with much job creation in the service sectors where labour productivity is lower than in industry. Nevertheless, the average productivity growth in 2009-2020 in Flanders and Wallonia was not lower than in the euro area. The drop in productivity growth was a general phenomenon and even resulted in an average negative figure in Brussels (figure 6).
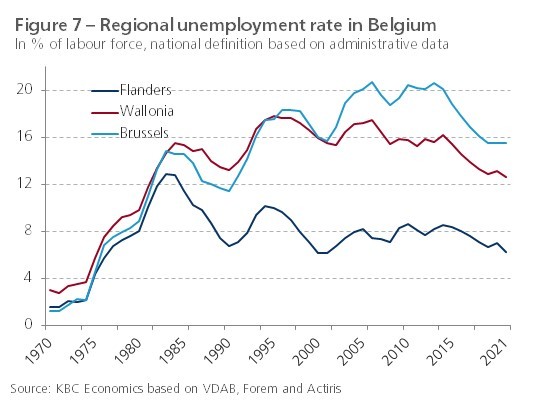
The low average employment growth in Brussels in 2008-2020 compared to the other two regions was also reflected in relatively poorer dynamics of the unemployment rate (the proportion of unemployed people within the labour force) and the employment rate (the proportion of people employed within the working-age population) (figures 7 and 8). This was at least the case until 2014: during the financial crisis of 2008-2013 both rates deteriorated more. Remarkably, the labour market situation in Brussels has improved spectacularly since then, allowing the still large gap with Wallonia and especially Flanders to be reduced. Against the background of the relatively weak economic growth in this region, this suggests that more and more Brussels residents have found a job outside the regional borders in recent years.
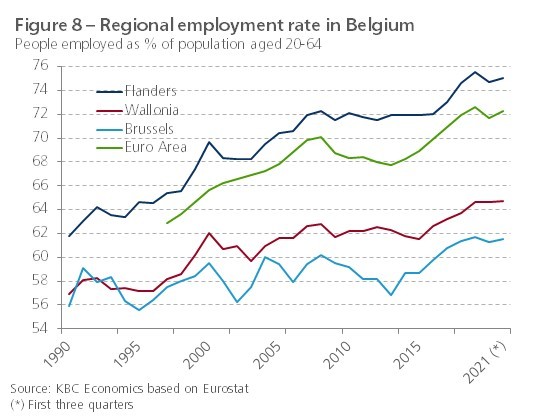
In 2020, the number of people employed on the territory of Brussels and Wallonia fell by 0.4% and 0.3% respectively. In Flanders, however, employment still increased by 0.2%, despite the pandemic's heavy impact on economic activity. Against the background of these figures, it is again striking that the employment rate and especially the unemployment rate in Brussels held up quite well in 2020. Flanders saw the largest decreases and increases in the employment and unemployment rates respectively in 2020. Combined with the still positive employment growth in Flanders (0.2%) and the considerable drop in employment in Brussels (-0.4%), this seems to indicate that there were Flemish people who lost their job in Brussels.
3. Regional business cycle indicators in 2021
As no regional growth figures are yet available for 2021, we do not have a good picture of the extent to which economic activity in three Belgian regions recovered last year from the sharp Covid-19 recession. In order to get some idea of this, we can use various business cycle and labour market indicators, for which 2021 figures have already been published, even on a monthly basis.
Regional differences in confidence indicators
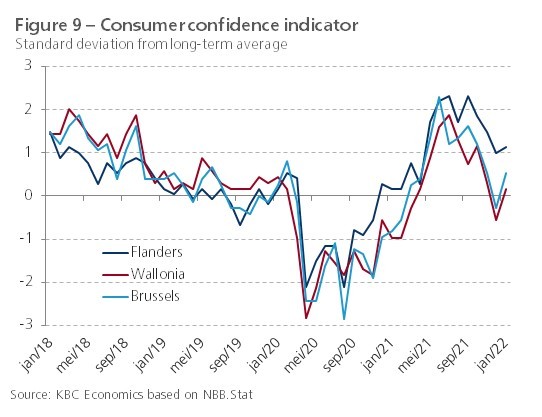
Traditional survey measures, including consumer and producer confidence indicators, can help provide an insight into the relative course of regional economic activity in 2021 (figures 9, 10 and 11). Because there are significant, long-term level differences between the raw time series of the three regions, we rescaled the confidence indicators for each region as a standard deviation of the long-term average. Figure 9 shows that consumer confidence in Flanders during the first half of 2020 corrected almost as much as in Wallonia and Brussels but improved more rapidly from the autumn onwards. In the spring of 2021, confidence also reached a level in Wallonia and Brussels that was significantly higher than before the pandemic. However, towards the end of 2021, when the fourth pandemic wave emerged, consumer confidence in Wallonia and Brussels fell faster and more sharply than in Flanders. In both regions, confidence even briefly fell below the pre-crisis level, while in Flanders it remained well above.
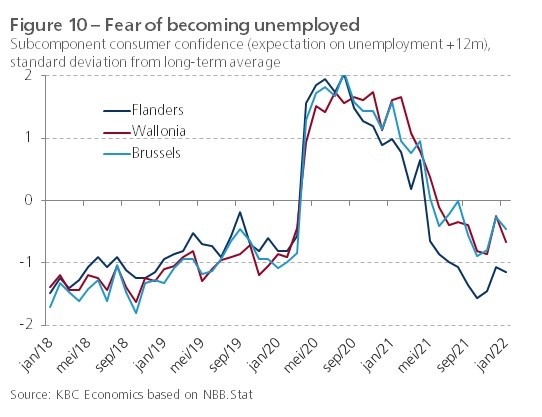
More specifically, the relatively stronger consumer confidence in Flanders is also reflected in the component that measures consumers' expectations of unemployment in the next twelve months (figure 10). For all three regions, this component points to a sharp decline in people's fear of becoming unemployed in 2020. But in Flanders, the indicator fell more sharply than in Wallonia and Brussels, even to below its pre-crisis level. The fading of unemployment fears is an important factor in reducing households' precautionary savings propensity and thus boosting consumption.
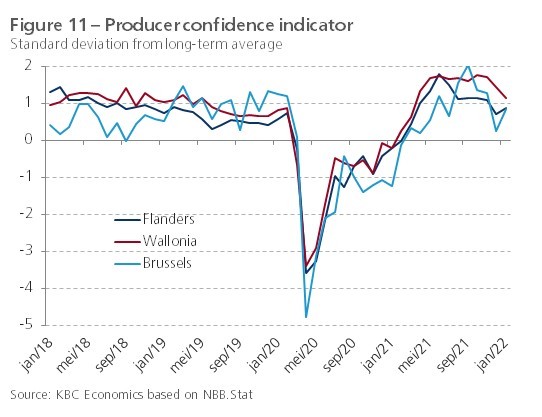
Producer confidence in 2020 followed a similar trend in Flanders and Wallonia, whereas it fell more sharply in Brussels during both the first and second waves of the pandemic. Against this background, it is surprising that the contraction of GDP in 2020 in Brussels (-5.2%) was scarcely greater than that in Flanders (-5.1%) and that in Wallonia (-5.8%) it was significantly greater than that in Flanders and Brussels (-5.2%). Also in 2021, the confidence of Brussels businesses initially lagged behind that of the other two regions. With a relatively small share of industry in added value, the capital region benefited less than Flanders and Wallonia from the robust industrial recovery that took shape in 2021. It is also notable that producer confidence in Flanders fell sharply from the summer of 2021 onwards. This may indicate that, as a more open economy, the region suffered more quickly and more severely from the increasing supply-side bottlenecks, namely shortages of materials, equipment and personnel.
In summary, confidence indicators show that consumer demand held up better in the second half of 2021 in Flanders than in the other two regions, but that on the business side, activity in Wallonia stayed at its peak for longer. However, we know from past experience that we have to be very careful about drawing firm conclusions from survey data, because in practice they do not always show a good correlation with the actual economic situation. They often have a relatively erratic course, which is explained by the fact that, in addition to economic influences, other (psychological) factors often also have an effect on confidence. During the pandemic, these were the general health situation and the restrictive living conditions, regardless of their impact on the economy.
Industrial production and exports
Therefore, it is good to include some frequently available 'hard' business cycle indicators in the regional analysis. Apart from labour market figures (see below), only a limited number are available, namely monthly figures (in nominal terms) on industrial production and export of goods. In figure 12 we show their dynamics for Flanders and Wallonia during the pandemic. In Brussels, with its typical service economy, the share of industry is only 2%, so the inclusion of that region in the analysis makes little sense.
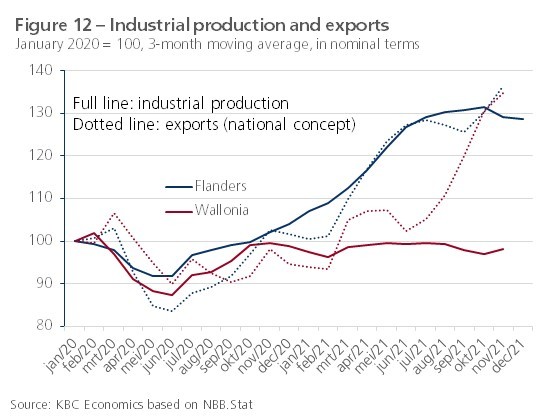
Compared to the service sectors, industry in Belgium rebounded quickly and strongly once the economy reopened. The resilience of industrial activity from the autumn of 2020 was particularly evident in the Flemish production figures. In Wallonia, the figures remained rather flat after the initial climb out of the Covid trough. The relatively strong rebound of Flemish industry was linked to the recovery of international trade, from which Flanders was able to benefit fully. In Wallonia, the export recovery took shape much later. More specifically, the pharmaceutical industry recorded very good results in the first three quarters of 2021. This branch of industry benefited from the huge demand for vaccines and their production was exported in large numbers. According to the NBB, this production contributed about 0.2 percentage points to the Belgian GDP growth in the first three quarters. The strong growth in the pharmaceutical industry mainly originated in Flanders at Pfizer in Puurs-Sint-Amands, where Covid vaccines are produced.
From the summer of 2021 onwards, industrial activity was increasingly hampered by bottlenecks in the supply of essential inputs and by labour shortages. At first, this put a brake on the still positive dynamics of industrial production, but towards the end of the year, the impact became more significant. The effects were visible in both Flanders and Wallonia but were not yet reflected in the latest export figures. In Wallonia, the turnaround in production figures came somewhat earlier than in Flanders, which contrasts with the regional figures on producer confidence (see earlier).
Resilient labour markets
Although Covid-19 heavily impacted economic activity in 2020, the impact of the pandemic on effective unemployment remained relatively limited. Figure 7, which we have already discussed in section 2 of this report, shows that the annual average unemployment rate (based on administrative figures) in Flanders and Wallonia only increased slightly in 2020 and even remained stable in Brussels. The relatively favourable development of effective unemployment in Brussels in 2020 is also reflected in the dynamics of the number of non-working jobseekers registered with the regional public employment services (VDAB, Forem and Actiris). Figure 13 shows that the yearly change in this group (thus eliminating seasonal effects) was relatively small in Brussels.
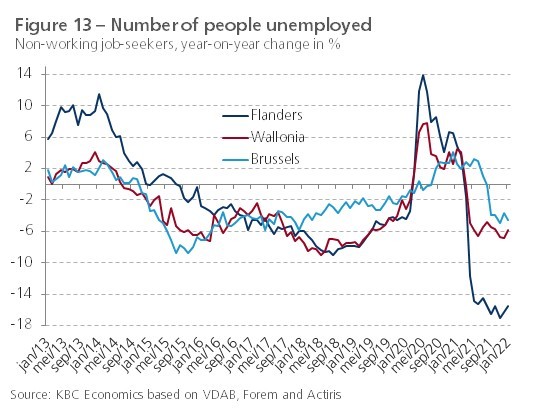
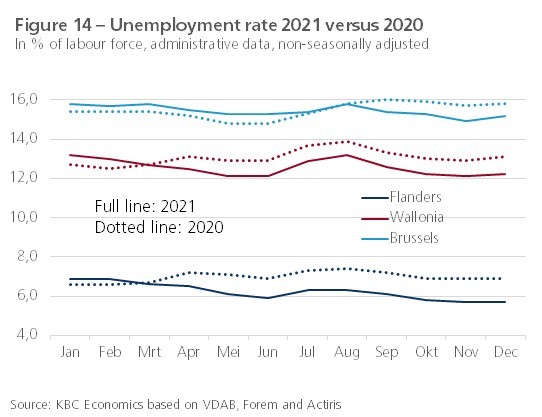
The unemployment rate (based on administrative figures) in the three regions fell in the course of 2021 below that in the corresponding months in 2020 (figure 14). In Brussels it took longer to do so and in Flanders the fall below the 2020 monthly figure was somewhat greater than in Wallonia. At the end of 2021, the unemployment rate in Flanders, Wallonia and Brussels was 5.7%, 12.2% and 15.2% respectively. The fact that the revival of the labour market in Flanders was more dynamic in 2021 than in the other two regions is also reflected in the relatively sharp drop in the number of unemployed job-seekers (Figure 13). The three regions ended 2021 with 16.3% (Flanders), 6.9% (Wallonia) and 3.6% (Brussels) fewer job-seekers than a year earlier. This also explains why consumer confidence in Flanders has remained at a higher level for longer (see earlier).
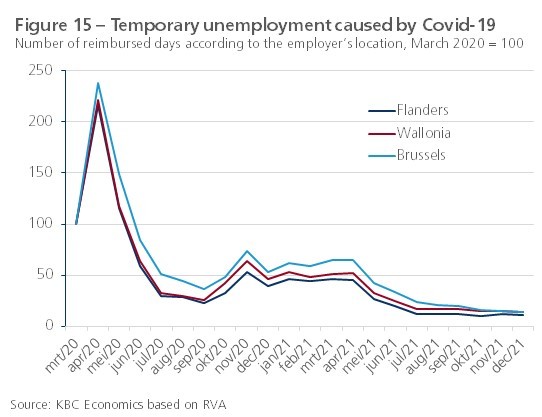
The fact that the labour market in the three regions held up well in 2020 was due to the decisive action of the government with support measures that limited the direct loss of jobs, including the extension of the temporary unemployment system. At the peak in April 2020, 0.79 million workers in Flanders, 0.34 million in Wallonia and 0.11 million in Brussels were in the system. Afterwards, that number fell back until September 2020, but increased again since then due to the second and third waves of the pandemic. In the spring of 2021, the number of temporarily unemployed dropped sharply again, after which it stabilised. When looking at the evolution of the number of reimbursed days according to the location of the employer, the regional differences in the use of the system throughout the pandemic were not that great (figure 15).