
Economic Perspectives September 2022

Read the full publication below or click here to open the PDF.
- European gas prices soared to unprecedented levels, in anticipation that Russia would suspend the supply of gas through the Nordstream1 pipeline as it has now done for an indefinite period of time. European gas prices are now hovering around €200/MWh, a fourfold increase compared to a year ago. Sustained high gas prices could have serious consequences for European industry and consumers. Leading indicators suggest a sharp slowdown in growth in the next two quarters and in 2023 in Europe, but do not point to a deep recession yet. In the eurozone, we now expect real GDP growth of 2.9% in 2022, slowing to 0.3% in 2023. Risks remain clearly tilted to the downside and the risk of a deep recession is no longer a tail risk.
- In turn, high gas prices are having a limited impact on the US economy, which is a net exporter of gas. The US labour market continues to perform particularly well, and consumer spending, non-residential investment and net exports continue to show healthy growth. These indicators even point to excessive demand. We have raised our real GDP growth forecasts by 0.2pp for both 2022 and 2023 to 1.7% and 1.0% respectively. Monetary tightening is increasingly weighing on the property market.
- The Chinese economy is facing its own problems. In the short term, new lockdowns in metropolises such as Chengdu and Shenzhen again cause concern. Zero-covid in general weighs on consumer spending and investment and could prolong existing disruptions to global supply chains. Problems in the property market also continue to mount. The announced fiscal and monetary stimulus will not be enough to prevent a serious growth slowdown for the time being. We have lowered our growth forecast and now expect growth of just 3% in 2022, recovering to 5.2% in 2023.
- High energy prices continue to drive up European inflation. In August, inflation reached a new high in the eurozone: 9.1% yoy compared to 8.9% yoy in July. Energy prices rose by a whopping 38.3% yoy. Core inflation also rose to 4.3% yoy from 4.0% yoy in July, a sign that inflation is becoming more widespread in the economy. We raised our average inflation expectations for the eurozone by 0.3pp for both 2022 and 2023 to 7.8% in 2022 and 4.6% in 2023.
- In contrast to the EU, inflation in the US fell for the second month in a row, from 9% yoy in June to 8.3% yoy in August. Falling oil prices and reduced supply chain problems are the main reasons for this decline. However, core inflation rose to 6.3% yoy in August mainly due to increases in shelter and medical care services. We have lowered our average headline inflation forecast for 2022 (for the first time in almost two years) by 0.1pp and expect inflation to be 7.9% in 2022 and 3.1% in 2023.
- Central banks have made the fight against high inflation their absolute top priority, possibly at the expense of economic growth. The ECB in particular has taken a major turn by raising its policy rates by 75 basis points in early September. This is the strongest interest rate adjustment in its history. Monetary tightening in the eurozone is far from over. We expect a gradual increase in the deposit rate to 2.5% in the first quarter of 2023. The Fed is also continuing to raise its policy rates at a record pace. We expect further policy rate hikes totaling 1.75 percentage points this year, which would bring the policy rate to 4-4.25% by the end of 2022.
The engines of the world economy are sputtering
The global economy is facing many large and asymmetric shocks. Securing gas supplies remains the most pressing issue for European policymakers. Gas prices rose to unprecedented levels this summer due to increasing uncertainty about Russian supplies. A prolonged high gas price in Europe is bound to have serious consequences for energy-intensive industries and European consumers. Monetary policy tightening in response to skyrocketing inflation and tight labour markets is also weighing on European growth prospects. Growth in the US is already under pressure, partly as a result of the monetary tightening that started earlier. The real estate sector in particular is starting to show clear signs of weakening. However, the US labour market is more resilient than initially expected. China, on the other hand, faces very different problems. New Covid-19 flare-ups in metropolises such as Chengdu and Shenzhen have led to new lockdowns and are indicative of the growth headwinds posed by an ongoing zero-covid policy. The property crisis is also affecting other sectors of the economy. Falling commodity prices (except for gas) and easing supply chain problems are small bright spots in a gloomy global economic picture.
European gas prices reach unprecedented heights
European gas prices reached unprecedented heights this summer. The gas price is now hovering around 200€/Mwh, a fourfold increase compared to a year ago.(see figure 1) The cause of this price increase lies again with Gazprom (or the Russian government). In July they decided to reduce the supply of gas through the critical Nordstream 1 pipeline to 20% of capacity. As a result, the gas price rose by 30% in July. Russia has now announced that it will cut off the gas supply via Nordstream 1 completely until the sanctions have been lifted.. Even if we disregard the temporary increase to more than EUR 300 per MWh at the end of August, the European gas price has more than doubled since the spring. Moreover, gas prices for deliveries have also risen sharply for the coming years (although these futures prices still point to a significant fall in the price of gas from 2023 onwards).
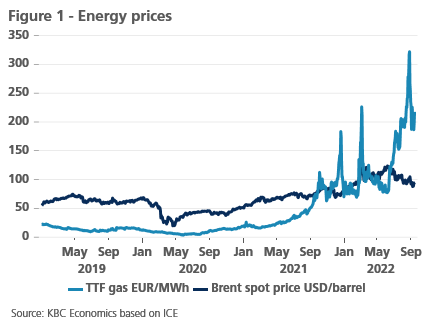
Oil prices, meanwhile, experienced a correction this summer. While the price of a barrel of Brent crude reached USD 123 in June, it is now hovering around USD 95 despite OPEC+’s recent decision to reduce production quotas by 100,000 barrels per day. The main reason for this decline is the slowdown in economic growth and the new lockdowns in China, which are weighing on oil demand. Also, Russian oil exports seem to be more resilient to the sanctions than expected. According to the International Energy Agency, Russia exported 7.4 million barrels per day in July, down from 8 million barrels per day before the start of the war.
Other commodity prices are also falling
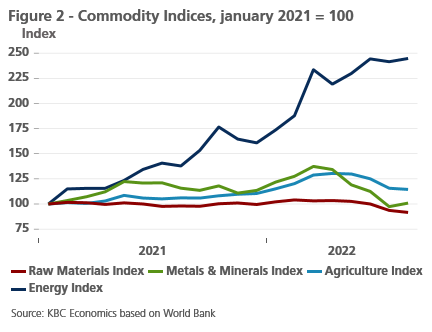
In addition to oil prices, other commodity prices also experienced a downward correction. (see figure 2) Food prices fell thanks to abundant grain harvests in Australia and relatively good grain harvests in the US and France. The restart of grain exports from Ukraine also contributed to the decline. Food prices fell 12% since the peak in April. The decline in food prices is most likely only temporary in nature. For instance, India, the largest exporter of rice (accounting for 40% of the global rice trade), suffered from an exceptional drought in the middle of the sowing season. High fertilizer prices also threaten to weigh on next year’s food production. Besides food prices, other commodity prices decreased as well. Lumber prices for instance dropped by about two thirds since their peak in March. Metal prices also experienced downward pressure. Copper prices fell by more than a quarter since their peak in March. The slowdown in the global economy is the main reason for these declines. However, most commodity prices are still above their pre-pandemic levels.
Supply problems are slowly diminishing
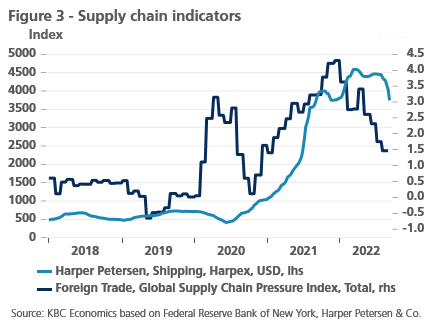
In addition to falling metal prices, reduced problems in supply chains are also positive news. (see figure 3) For example, shipping prices on the Harpex Shipping Index have fallen 12% since their peak in March. The number of companies reporting longer delivery times has also fallen sharply in most countries. Shortages in the semiconductor industry, crucial to many industries, have also been reduced and surpluses are starting to emerge in that sector, leading to price reductions of more than 50%. As a result, the New York Fed’s Global Supply Chain Pressure Index has dropped from 4.3 to 1.7 in less than a year. However, this does not mean that all supply problems have been solved. For example, the closure of certain energy-intensive companies in Europe due to high gas prices, LNG bottlenecks and further lockdowns in China could push the index back up.
Inflation in the eurozone continues to rise
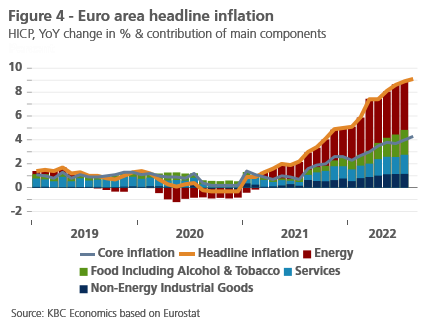
Improvements in the supply chain do not mean the end of inflationary pressures. In yoy terms, euro area inflation rose further to 9.1% in August. (see figure 4) The main contribution to inflation continues to come from the increase in energy prices, although this has declined slightly in recent months from 42.0% in June to 38.3% in August. The further rise in inflation in recent months is therefore due to the acceleration in food prices (from 5.0% in March to 10.6% in August) and core inflation, which now stands at 4.3% compared to 3.0% in March. Indirect effects - and probably delayed reopening effects after the pandemic - pushed up the price of non-energy items from 3.4% in March to 5% in August, while service inflation accelerated from 2.7% to 3.8%, with peaks of 14% to 15% for package holidays and hotels in June and July.
The stronger than expected indirect effects of the energy price hike on core inflation and the recent further rise in gas prices explain why we have raised the inflation outlook further to an average of 7.8% (instead of 7.5%) for 2022 and 4.6% (instead of 4.3%) for 2023. We are assuming that, overall, the second-round effects of wage increases will remain limited. However, the uncertainty surrounding this remains large, given, among other things, the structural tightness of the labour market and the measures that governments might still take to temper the rise in energy prices. In this context, the ECB’s strong signal of a 75 basis point increase in interest rates may already help to limit wage increases by keeping inflation expectations in check. Apart from that, the uncertainty surrounding the inflation outlook remains very high due to the volatility of energy markets and the complexity of the transmission of these market prices to consumer energy prices. For now, the risks remain mainly on the upside.
Inflation in the US down for two months in a row
In contrast to the EU, year-over-year inflation in the US fell for the second month in a row, from 9% in June to 8.3% in August. (see figure 5) Falling gasoline prices were the main driver of this decline, while gas prices have also remained under control, thanks to the domestic shale gas production. Gas prices are now about 7 times lower than in Europe. Consequently, energy price inflation fell from 41.5% in June to 23.9% in August, although electricity prices jumped 1.5% m/m. We also see some signs of reduced supply chain problems. For example, second-hand vehicle prices fell for the second month in a row. On the other hand, a new troublemaker in headline inflation seems to be food prices, which grew by 0.7% m/m (already up 1.3% m/m in July).
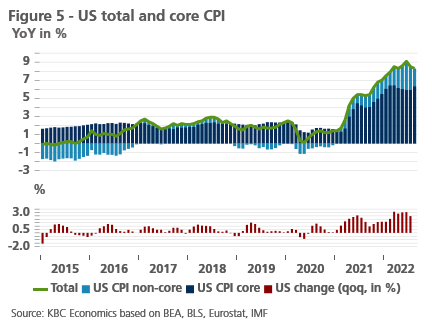
Core inflation remains worryingly high, however, reaching 6.3% in August, up 0.4 pp from July. Shelter prices rose 0.7% m/m and we don’t see any immediate improvement here in the near term. House prices rose much faster than rents during the Covid crisis and the price-to-rent ratio is now even higher than before the 2008 financial crisis. We expect a further catching up of rents in the coming months, which would keep upward pressure on core inflation readings in upcoming months.
All in all, the robust August inflation readings imply that headline inflation has probably peaked in year-on-year terms, while the core inflation will form (technically speaking) ‘a double top formation’ at around 6.4% with the second reached very likely in September.
Central banks make fighting inflation their top priority
Government bond yields corrected during June and July. Indeed, markets wrongly assumed that the increasingly gloomy growth outlook and recessionary risks would tie the hands of central banks. This proved to be a misjudgment which became clear after the firm statements by ECB and Fed policymakers at the annual Jackson Hole symposium: fighting inflation and anchoring expectations remain the unconditional number one priority. Fed Chairman Powell made it abundantly clear that high inflation requires further monetary tightening and that it would be premature to ease policy as soon as next year. The policy rate will certainly remain higher for longer.
We expect the US central bank to raise interest rates by 75 basis points for the third consecutive time in September. This would bring the benchmark interest rate up into the 3% to 3.25% range. Some of the Fed’s voting members (the FOMC) favour a final rate above 4% early next year. This is also our expectation. Since early September, the Fed has been supplementing rate hikes with Quantitative Tightening at cruising speed. The (inflated) balance sheet of USD 8.8 trillion will be reduced at a rate of USD 95 billion per month. If that target is not met by bonds coming to maturity, the Fed will sell additional active Treasury securities.
At the meeting in Jackson Hole, several ECB members also expressed discomfort with market interest rates in the eurozone during the summer months. Among them, the influential German Governing Council member Schnabel seized the opportunity to propose and eventually secure a 75 basis point increase at the September meeting. After the previous 50 basis point increase in July, the ECB deposit rate now stands at 0.75%. The end of the normalisation path is not yet in sight. We expect policy normalisation to be frontloaded. Our baseline scenario is in line with the money markets and assumes another 75 basis points move in October and does not rule out another such move in December. The ECB balance sheet reduction will be discussed for the first time at the October meeting. It will probably take until the last policy meeting in 2022 for the ECB to come up with an action plan for this. Either way, the ECB’s tight monetary policy risks not only fighting inflation but also weighing on economic growth.
Resilient eurozone economy...
The eurozone economy proved more resilient than expected and feared in the first half of the year. According to the latest figures, real GDP in the eurozone grew by 0.8% in the second quarter compared to the previous quarter, after growing by 0.7% in the first quarter. That is 0.1 percentage points and 0.2 percentage points, respectively, more than the growth estimates at the end of July. In particular, the growth path of the German economy was revised upwards: the previously estimated contraction of real GDP in the fourth quarter of 2021 (-0.35%) and the second quarter of 2022 (-0.04%) has been revised upwards according to the new figures (-0.03% and +0.14% respectively), while the growth for the first quarter was raised from 0.2% to 0.8%.
Household consumption in particular, but also all other components of domestic demand, contributed to the relatively strong growth in the second quarter. The fall in consumer confidence to an all-time low and the loss of purchasing power due to high inflation did not seem to hinder (for the time being) the catch-up demand following the reopening of the economy after the pandemic. The fact that employment continued to grow and the unemployment rate fell further to a historical low may have contributed to this. Manufacturing output in the second quarter was also somewhat better than the slump in producer confidence in recent months: in the three months to June, output in volume terms was 0.6% higher than in the previous three months, and even up 3.2% yoy in June.
...will weaken considerably
The relatively strong economic performance in the first half of the year does not diminish the fact that the eurozone economy faces an extremely difficult period ahead. The sky-high gas prices are obviously the main reason for the gloomy economic outlook. This will be a tough nut to crack, especially for the highly industrialised economies, with Germany in the lead. The faster-than-planned replenishment of gas stocks is a ray of hope in this regard. It reduces the risk of forced rationing in the coming winter. The measures proposed by the European Commission and others to use energy more efficiently can also contribute to this. But the high cost of gas supplies will undoubtedly further erode the profitability and competitiveness of a number of companies and increase the likelihood that production will have to be cut back.
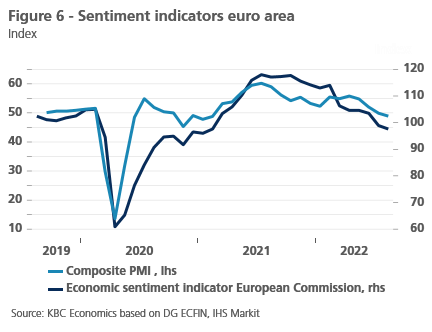
Against this background, business confidence, as measured by the European Commission’s economic sentiment surveys or the PMI indices, has continued to deteriorate. (see figure 6) However, compared with the fall recorded at the start of the pandemic, this deterioration remains more limited for the time being (Figure 6). The indicators currently point to a halt in economic growth or a slight contraction in activity rather than a very deep recession.
This is the basis for our growth projections in our baseline scenario: a slowdown in the third quarter of 2022, followed by a stagnation in the two subsequent quarters, with only a very difficult and weak recovery in the quarters that follow. In the annual average growth rates for real GDP, this translates into a still quite strong growth rate for 2022, which is however only due to the strong first half of the year (2.9%, which due to the upward revision of the historic figures has even been revised slightly upwards compared to last month), but a very weak growth rate for 2023 (0.3%, against an expectation of 0.4% last month). Nevertheless, the risk that even this low growth rate will not be achieved remains high. The uncertainty relates not only to questions of how high energy prices will remain and for how long, but also to the resilience of companies to adapt to them, and the effectiveness of the measures being taken by governments to mitigate the impact.
The US economy is coming under pressure from monetary policy
In the US, the labour market continues to perform strongly. Total employment rose by 315,000 in August, following a 526,000 increase in July. Also noteworthy was the sharp rise in the participation rate by 0.3 percentage points to 62.4% and the related rise in the unemployment rate by 0.2 percentage points to 3.7%. These figures suggest that the labour market is less tight than we had initially expected. Consumer spending, non-residential investment and net exports also continued to show solid growth in the third quarter. As a result, we have revised our forecast for real GDP growth in the third quarter upwards from 0.2% to 0.5% qoq.
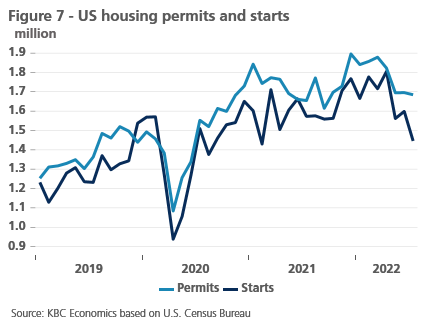
The picture for the later quarters looks less rosy due to monetary tightening and weakness in key trading partners such as the EU and China. US consumer confidence has improved somewhat, thanks to the drop in gas prices over the summer, but it is still worryingly low. The sub-indicators on new orders in the PMI surveys also point to weakness in the later quarters. In the real estate sector, monetary pressures are also starting to bite. Construction spending has fallen for two consecutive months. Residential building permits also fell 12% in July from their peak in December 2021. (see figure 7) All in all, we maintain our downside growth forecast of 0% qoq GDP growth in Q4 2022, and we forecast annual average growth of 1% in 2023.
New lockdowns and a liquidity crisis in real estate undermine Chinese growth
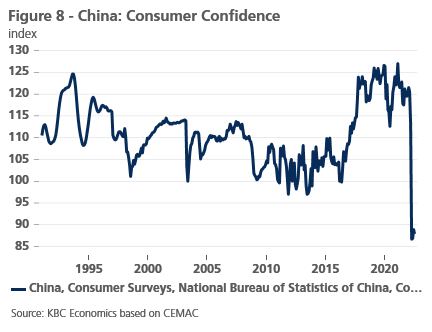
The economic outlook in China has deteriorated in recent months as the recovery from covid lockdowns in the first half of the year has been held back by a number of factors. First, policymakers have not deviated from zero-covid despite its high economic cost. Throughout the summer, the threat of new lockdowns (sporadically imposed in certain smaller cities and regions) and the burden of strict testing measures weighed heavily on consumer confidence, which remains close to April’s all-time low (Figure 8). Recent measures in major cities (Shenzhen and Chengdu) suggest even further headwinds to the growth outlook in Q3 2022. While it is not impossible that communication on the future trajectory of China’s zero-covid policy could come around the time of the Chinese Communist Party’s National Congress held in mid-October, it is more likely that a major change would come in the spring of 2023 given normally higher transmission rates in winter. This would also coincide with the annual “Two Sessions” meetings in China, when policy decisions and priorities are often communicated.
The second major factor that continues to drag on the economy is the liquidity crisis in the real estate sector. Real estate prices declined for the eleventh month in a row in July, and a ‘mortgage boycott’ among homebuyers highlights just how fragile confidence in the sector has become. The central bank and finance ministry recently announced that approximately USD 29 billion in special loans would be made available to developers to help them complete stalled development projects. This aims to restore some confidence among homebuyers and prevent a further spiraling of the crisis to other sectors of the economy, but it does not address the underlying problems facing highly indebted real estate developers.
Given these headwinds, we have downgraded the outlook for both Q3 and Q4 growth in China. While a recovery is still in the cards, the strength of that recovery will be somewhat weaker than previously expected. This results in growth of only 3.0% in 2022 (down from 3.2% previously), and 5.2% in 2023 (down from 5.5%). Despite this downgrade, risks remain titled to the downside.
All historical quotes/prices, statistics and charts are up to date, up to and including 12 September 2022, unless otherwise stated. The positions and forecasts provided are those of 12 September 2022.