

Economic Perspectives October 2018

- Highlights
- Global Economy
- Growing at different speeds
- US focus on China
- Inflation muted, underlying forces building
- Markets and the Fed’s view
- Italian budget collision
- Growing at different speeds
- Belgian Economy
- (Technical) upward revision of unemployment
- (Technical) upward revision of unemployment
- Most recent forecasts
Read the publication below or click here to open the PDF
- While the global economy continues to perform well, the geographic desynchronization has picked up. In recent months, there have been increasing divergences across regions and sectors. The US economy remains in the lead, but the European and Japanese economies’ growth momentum has slowed compared to the uptick seen at end-2017. As such, we see a growth peak for the US in 2018 at 2.9%, while growth in the euro area will decelerate this year compared to its 2017 pace.
- The USMCA, the new trade agreement between the US, Mexico and Canada that will replace NAFTA, was a relief for businesses as it reduced the uncertainties regarding a possible termination of NAFTA and threatened tariffs on US automotive imports. It is also a political win for President Trump as a NAFTA reform was one of his main election promises. After some strategic threats, the US now appears to be seeking a truce on the international trade front with its top allies. This gives the US the opportunity to focus on its escalating economic confrontation with China.
- Core inflation data for the euro area remain muted, while headline inflation is in the range of the ECB’s target of “below but close to 2%”. Draghi’s comment of “a vigorous pick-up in core inflation” however, can be underpinned by the gradual upward trend of wage indicators in several euro area economies. This could be a sign of increasing inflationary pressures going forward. The gradually changing tone of the ECB’s communication should be interpreted as the ECB signalling to financial markets that the output gap is closing in the euro area, which warrants a policy normalisation. Therefore, we expect a first policy rate hike by the ECB in September 2019.
- As foreseen in our scenario, financial market turmoil around the Italian budget negotiations intensified in recent weeks. Although the details of the 2019 draft budget have yet to be published, the government already submitted a proposal for the 2019-2021 budget deficit targets. The plan differs considerably from the former government’s budget targets and is at odds with guidance from the European Commission. Tensions between Italy and the European Commission are likely to peak in the coming weeks. This will likely lead to further financial market volatility and potential spikes in the Italian government bond yield and spread to the German bond yield. Once the 2019 budget is approved by the Italian Parliament, we think volatility will ease somewhat.
- The ongoing trade war between the US and China, tightening Fed policy and internal problems in some countries create a challenging environment for emerging markets, which is leading to higher rates and spreads. Individual emerging markets will likely remain confronted with idiosyncratic risks, but our base scenario doesn’t contain a systemic emerging market crisis.
Growing at different speeds
While the global economy continues to perform well, the geographic desynchronization has picked up. In recent months, there have been increasing divergences across regions and across sectors. The US economy remains in the lead, boosted by growth supportive fiscal effects and continued strong performance in the labour market. The September reading for the ISM non-manufacturing reached its highest level (at 61.6) since the start of the series in 2008, confirming that the services sector, which is by far the most important for the US economy, is soaring (figure 1). Correspondents of the survey were very optimistic on current and future business conditions. Their main concern was tightening supply conditions, leading to upward price pressures. Moreover, also the uncertainties surrounding global trade and tariffs were on top of their mind. This is in line with our view of the US economy: thriving in a late-cyclical stage, with potential internal and external risks looming.
Figure 1 - US economy booming while other economies grow at a decelerated pace (corporate sentiment indicator non-manufacturing sector)

In contrast, the European and Japanese economies’ growth momentum, while still healthy, has softened since the uptick in end-2017. The Chinese growth engine also appears to be losing steam. By introducing new fiscal measures and credit stimulus, the Chinese authorities are attempting to keep growth in line with target levels and avoid a hard landing. However, already heavily leveraged (corporate) balance sheets limit their ability to act.
The desynchronization of growth between the US - performing strongly due to persistent strong labour market performance and growth-inducing fiscal stimulus - and the rest of the world is exacerbated by concerns on the international trade front. The manufacturing or tradeable goods sector is lagging behind services in recent months, largely due to the uncertainties surrounding global trade disputes. As a result, growth of world trade volumes has decelerated in recent months (figure 2). This downward trend in both sentiment and activity data is visible across regions. The main exception has been the US. For now, positive growth effects from tax stimulus etc. are still outweighing any negative impacts of the trade war. This is why our scenario contains a growth peak for the US in 2018 at 2.9%, while growth in the euro area will decelerate this year compared to its 2017 pace.
Figure 2 - Deceleration of world trade volume growth (% change yoy, 3 month moving average)
US focus on China
Headlines about international trade were mixed in recent weeks. Positive news came from negotiations between the US, Mexico and Canada. The three parties succeeded in finding an consensus on a new version of the former NAFTA agreement. The new deal - called the US-Mexico-Canada Agreement (USMCA) - contains revised trade relation rules as well as some new chapters that make it more suitable for modern times (e.g. new chapter on digital trade). Under the USMCA, the US will have larger access to Canada’s dairy market. Regarding the automotive industry, the three countries agreed to higher local-content requirements. 75% of automotive parts, instead of 62.5% under NAFTA, have to be sourced from US, Mexico or Canada by 2025 or 5 years after entry into force of the USMCA. Furthermore, 40-45% of workers in car manufacturing plants have to earn at least $16 an hour. Canada was able to retain a dispute settlement system used to challenge US countervailing and anti-dumping duties (the so-called Article 19). The deal also contains a sunset clause. The USMCA’s lifespan is limited to 16 years. After 6 years, the agreement will be jointly reviewed and the lifespan potentially extended. This is different from the old NAFTA, as that had no expiration date. As such, there may still be some uncertainty for companies looking to make substantial physical investments. The implemented US import tariffs on steel and aluminium are not part of the USMCA and hence remain in place.
Looking forward, the signing of the USMCA by the three parties is scheduled next month. Afterwards, the deal will have to approved at the national levels. A potential remaining hurdle for the finalization of the agreement is the US ratification process. The Congressional vote on an implementing bill will likely follow in 2019. This implies the Congressional composition could be important and this will potentially change depending on the outcome of the midterm elections in November. Given polls and historical evidence, the most likely scenario is a split Congress with Republicans retaining their majority in the Senate but a Democratic win in the House. While Democrats can still put a stop to the deal, the consequences of no deal would be severe and cause potential problems for Democratic candidates in the run up to the 2020 US presidential elections. Nevertheless, the news of the USMCA was a relief for businesses as it largely reduces the uncertainties regarding a possible termination of NAFTA and threatened tariffs on US automotive imports. It is also a political win for President Trump as a NAFTA reform was one of his main election promises. Moreover, the new agreement may be regarded as a proof of the successful trade policy stance by the Trump Administration triggering similar assertive approaches versus other trading partners.
After some strategic threats, the US now seems to be seeking a truce on the international trade front with its top allies. Following the Juncker-Trump agreement, trade talks with the EU are ongoing. The US also started bilateral trade talks with Japan. As US trade representative Lighthizer said: “The reality is that if we end up making some kind of an agreement with Japan, we basically got the net effect of Trans-Pacific Partnership without having to go through the problems and without having to have all the enforcement difficulties”. This gives the US the opportunity to focus on its escalating economic confrontation with China. With the implementation of additional import tariffs on Chinese products worth $200 billion at the end of September and threats of new tariffs on top of that, further escalation seems highly likely. While the effects on the US economy stay rather contained for now, it wouldn’t take long for negative impacts to seep through.
Inflation muted, underlying forces building
Preliminary data for September inflation in the euro area surprised to the downside. Headline inflation marginally increased from 2.0% to 2.1% yoy. This was mainly driven by a re-acceleration in food and energy inflation. Underlying core inflation, excluding volatile components, was disappointingly low as it dropped to 0.9% yoy from 1.0% previously (figure 3). The muted inflation developments are consistent with our scenario and the cautious stance the ECB took at its June policy meeting. ECB President Draghi stated back then that the first step towards a policy rate normalisation will only be taken at the earliest after the summer of 2019.
Figure 3 - No vigorous pick-up in euro area core inflation yet (inflation components, % change yoy)

More recent communications from ECB officials, however, changed tone somewhat. ECB president Draghi commented in European Parliament that “a vigorous pick-up in core inflation” is seen. At first sight this seems to be contradicting recent inflation figures. However, this statement is more forward-looking rather than referring to inflation data from the past. It can be underpinned by the gradual upward trend of wage indicators in several euro area economies, which could be a sign of increasing inflationary pressures going forward. Additionally, ECB Chief Economist Peter Praet and Governor Benoit Coeuré, said that the ECB should soon communicate on the speed of the policy rate normalisation process, as its start is gradually approaching. This should be interpreted as the ECB wanting to signal to financial markets that the output gap is closing in the euro area, which warrants a policy normalisation. Therefore, we expect a first policy rate hike by the ECB in September 2019.
Markets and the Fed’s view
As widely anticipated, the Fed hiked its policy rate by 25 bps from 1.75%-2% to 2%-2.25% at its September meeting. The upward revision of the Fed’s GDP projections for this year and next was mainly an adaptation to current US economic strength. The Fed now expects growth to hit 3.1% in 2018 (up from 2.8%) and 2.5% in 2019 (up from 2.4%). Our scenario is hence slightly less optimistic for this year (2.9%) but similar for 2019. Both headline and core inflation hover slightly above the Fed’s 2% target throughout the forecasting period. The FOMC statement was extremely similar to August’s, apart from the Committee dropping a reference to the “accommodative” character of the policy stance. Fed chair Powell stressed that this doesn’t mean that the Fed will be more reluctant to hike rates going forward. He referred to the lower bound of the Committee’s projections for the neutral rate which is 2.5%. Monetary policy actually remains stimulative for the US economy even if the Fed no longer spells it out.
Market reactions to the FOMC meeting were muted. Sharp market moves followed at the beginning of this month though, as the 10y US bond yield jumped up to its highest level since 2011. Strong macroeconomic data, with solid services sector performance, a rise in the oil price and very optimistic statements from Fed Chairman Powell appear to be the main causes. Powell signalled that the Fed may gradually raise rates above the so-called neutral rate, meaning that monetary policy will become restrictive. Financial markets began to take this more into account as the real interest rate jumped above 1% for the first time since 2011. Hence, the markets’ view is moving in the direction of the Fed’s proposed interest rate path.
Italian budget collision
As foreseen in our scenario, financial market turmoil around the Italian budget negotiations soared in recent weeks. Although the details of the 2019 draft budget haven’t been published yet, the government already submitted a proposal for the 2019-2021 budget deficit targets in the Economic and Finance Document (NADEF). Initially, the Italian 5SM-League government’s draft budget proposal targeted a general government budget deficit of 2.4% of GDP for the next three years. This would not be in line with its agreement with the European Commission (EC) as it overshot the agreed deficit targets by a cumulative 6.6 p.p. over the next three years. Moreover, the proposal signalled that the current government wants to let go of fiscal consolidation and associated EU rules. Since the initial version, updates have been submitted. The latest contains deficit targets of 1.8% of GDP this year, 2.4% of GDP in 2019, 2.1% of GDP in 2020 and 1.8% of GDP in 2021. The government plans to implement some of the fiscal measures that were in its economic programme such as universal income and pension reforms.
Since the deficit targets are based in GDP growth assumptions that are more optimistic than ours, they seem rather unrealistic. And although containing a downward path of the deficit, it still differs considerably from the former government’s budget plans. Furthermore, the deficit targets would imply that the future decline of the debt-to-GDP ratio comes to a standstill, even without taking into account any rise in interest rates.
Italy has to submit the draft 2019 Budget to the European Commission (EC) on 15 October at the latest. The document has to contain the details on budgetary measures, consistent with growth and budget deficit targets indicated in the NADEF. By the end of October, the EC will likely respond. It is not unlikely that the EC will reject the proposal and ask for necessary adjustments to comply with the Stability and Growth Pact. Hence, tensions between Italy and the European Commission are likely to peak in the coming weeks. This will lead to financial market volatility and potential spikes in the Italian government bond yield and spread to the German bond yield. Once the 2019 budget is approved by the Italian Parliament, volatility will likely ease somewhat.
While the Italian budget outline is not ideal in terms of government debt dynamics and is not in compliance with European Commission rules, the proposed budget plans are not necessarily disastrous in the short-term. From a macroeconomic point of view, the risk is mitigated by the fact that Italy has a domestic savings surplus and the country’s net international investment position is broadly balanced. The flipside of this domestic funding is a large exposure of Italian banks and other financial institutions on the Italian government debt. As roughly 50% of government debt is held by Italian financial system, this implies a possible systemic risk. Moreover, Italy is also a significant risk to the banking sector in several other euro area countries, such as France, Spain and Portugal. Although the main focus is currently on Italy, other EMU countries have to submit their draft budgets to the EC too. This will potentially cause additional volatility in the weeks ahead.
While consumer and producer sentiment indicators in Belgium are still at reasonable levels, they are now well below the record highs that were observed in late 2017. Since Spring, Belgian consumers have been cautious, alternating between a loss and recovery of optimism. In September, the consumer confidence indicator picked up a little again, reversing the previous month’s dip. Producer confidence firmed up a little again in September as well. The improvement in the NBB barometer was only seen in Wallonia, however. In Flanders and Brussels the barometer continued its downward trend. The Flemish figure even declined below the Walloon one in September (figure 4), the first time since the financial and economic crisis in 2008-2009.
Figure 4 - Producer confidence in Flanders has fallen below the one in Wallonia (NBB barometer)

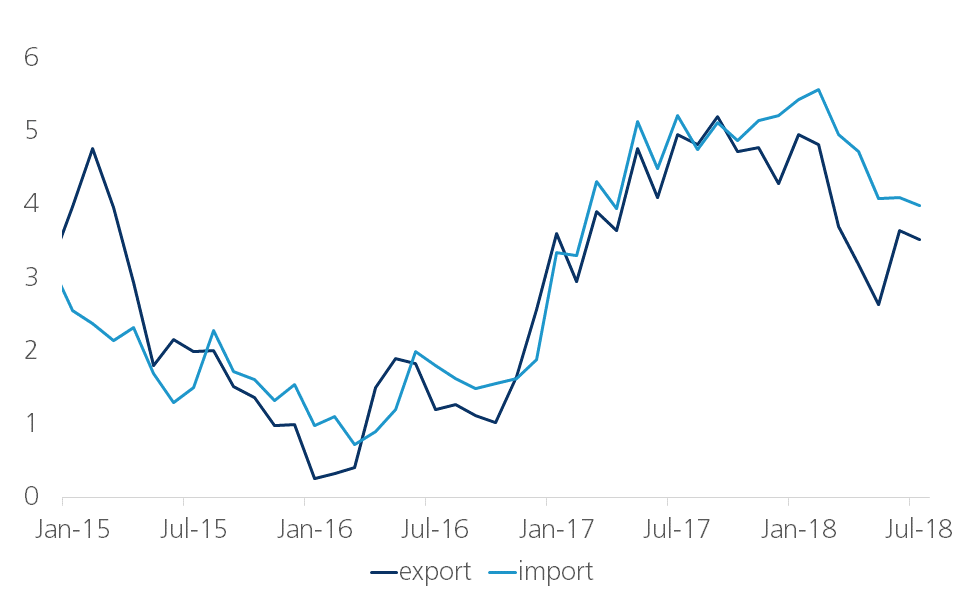
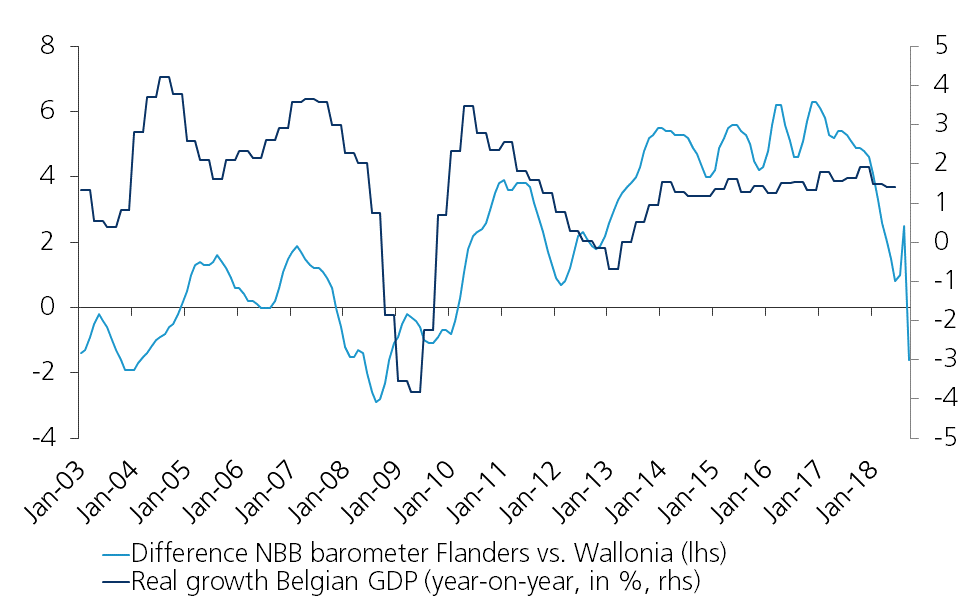
As Flanders is a more open economy, it is more vulnerable to a worsening in the international economic environment. In the past, a decline in the Flemish NBB barometer below the Walloon figure often went hand in hand with a slowdown, or even recession, of the total Belgian economy, and vice versa (figure 5). In the first half of the year, economic activity in Belgium was still, to a large extent, supported by net exports. We believe that this will no longer be the case in the current and next quarters, as export dynamics will gradually slow down. For the full year 2018, the growth contribution of net exports will still be positive, albeit less than in 2017. In 2019 we see net exports contribute negatively to GDP growth. Against this background, real GDP growth in our scenario will slow down from 1.7% in 2017 to 1.5% this year and 1.4% next year.
Figure 5 - Relative regional development of NBB barometer pointing at a slow down of Belgian GDP growth
(Technical) upward revision of unemployment
Eurostat revised figures for Belgium’s unemployment rate. Previously, the harmonised unemployment rate (which is based on a survey) stood at 6.2% in July. In the new series recently being published, the unemployment rate climbed from a low of 6.1% in January till March to 6.6% in July. The latest figure, for August, was at 6.5%. The Belgian unemployment series often has been quite volatile in the past, subject to many revisions, and hence its recent development must be interpreted with care. Nevertheless, it could be an indication that the decline in the unemployment rate is gradually bottoming out. The year-on-year change in the number of non-working job seekers (an unemployment series based on administrative data) went up strongly as well. This, however, was solely due to a technical revision of the category ‘Autres demandeurs d’emploi inscrits obligatoirement’ in Wallonia, which is part of the group of non-working job seekers but does not receive any unemployment benefits.
All historical rates/prices, statistics and graphs are up to date, up to and including 8 October 2018, unless otherwise stated. The views and forecasts provided are those prevailing on 8 October 2018.