

Economic Perspectives October 2023
Read the full publication below or click here to open the PDF.
- The global economy continues to run at multiple speeds: significantly stronger than expected in the US, weak but with first signs of improvement in China and drifting between growth and contraction in the eurozone, with timid signs of bottoming out, especially in manufacturing. For the US, we have slightly upgraded our forecast for real GDP growth from 2.2% to 2.3% for 2023, but left it unchanged at 0.9% for 2024, as mounting headwinds, including from strikes in the auto sector and political uncertainty, will weaken the recent strong momentum. For the eurozone and China, recent economic indicators are broadly in line with expectations, leaving our growth forecasts unchanged for both 2023 and 2024: 0.5% in 2023 and 0.7% in 2024 for the eurozone and 4.9% in 2023 and 4.1% in 2024 for China.
- In the US, inflation remains on a downward path, with two potential disruptors: volatile fuel prices and used car prices (and possibly new car prices). For core inflation, we maintain our outlook of a relatively benign path. But due to higher fuel prices, we have slightly raised our outlook for expected headline inflation from 4.1% to 4.2% on average for 2023 and from 2.5% to 2.6% for 2024.
- In the euro area, inflation fell sharply in September. All major subcomponents contributed. As such, core inflation is also cooling gradually, but it looks like the cooling may be a little smoother than previously envisaged. We slightly lowered our inflation outlook for the eurozone from 5.7% to 5.6% on average in 2023 and from 3.1% to 2.9% in 2024.
- The Fed left its policy rate unchanged at 5.375% in September, but the ECB raised its deposit rate to 4.0%. Our assessment is that both central banks have ended their cycle of rate hikes, although the certainty of this is greater for the ECB than for the Fed, which might still raise its policy rate one last time later this year. We also expect the first rate cuts to come later and more cautiously than previously projected. For the Fed, we expect a first policy rate cut (by 25 basis points) no longer in the second quarter of 2024, but only in the third quarter, followed by two further cuts in the fourth quarter to 4.625% by the end of 2024. The ECB is not expected to cut its deposit rate to 3.75% until the fourth quarter of 2024.
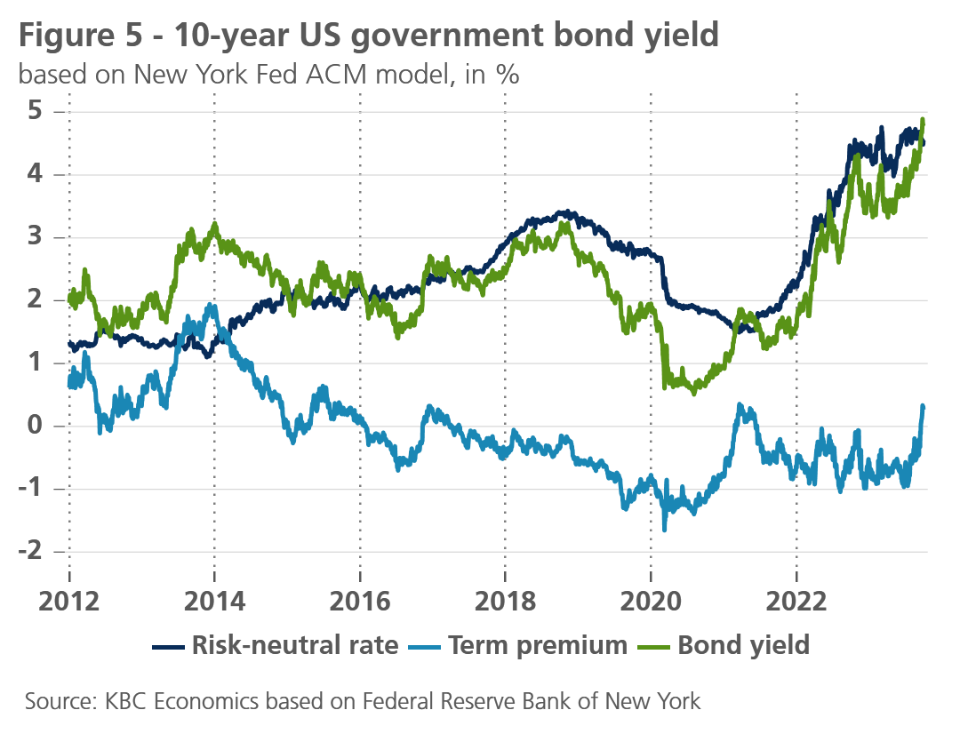
- The most notable observation in recent weeks has been the sharp rise in yields on long-term US and German government bonds. The rise is caused by the decompression of the term premium in interest rates. This was kept artificially low for a long time by the monetary policy of quantitative easing. Now that quantitative tightening has been going on for a while, this premium is normalising. It means that long-term interest rates will remain higher than estimated so far. We expect yields of 2.95% at the end of 2023 and 2.75% at the end of 2024 for 10-year German government bonds and of 4.80% at the end of 2023 and 4.20% at the end of 2024 for 10-year US government bonds.
The world economy continues to run at different speeds: significantly stronger than expected in the US, with first signs of improvement in China, and oscillating between growth and contraction, with timid signs of bottoming out (especially in manufacturing) in the eurozone. At the same time, uncertainty remains high. Structural challenges will weigh on economic growth in China and the eurozone, while headwinds are also building in the US.
Encouraging signs from China
After several months of disappointing activity data in China, September data suggest some upward momentum to growth at the end of the third quarter. Industrial production grew 0.5% month-over-month while retail trade grew 0.31% month-over-month. Sentiment data was more of a mixed picture, with the S&P global PMIs for both the manufacturing and service sectors declining (to 50.6 and 50.2, respectively) while the official (NBS) PMIs improved marginally (to 50.2 for the manufacturing sector and 51.7 for the non-manufacturing sector).
The fact that both manufacturing PMIs are now in positive territory, however, is an encouraging signal for a pick-up in industrial activity. However, the long-standing structural challenges we’ve highlighted in the past (especially an over-indebtedness of the household and corporate sectors) remain an important drag on growth going forward, and the various policy initiatives introduced so far will likely be inadequate to provide a sustainable boost to growth. We therefore maintain our 2023 outlook for GDP growth at 4.9%, just below the government’s 5.0% target, and maintain our outlook for 2024 at 4.1%.
Surprisingly strong US economy
The US economy remains in very good shape. All indicators on both demand and supply developments suggest that growth remained above potential until the end of the third quarter. Based on hard economic data, we estimate Q3 growth at 4.1% (qoq annualised).
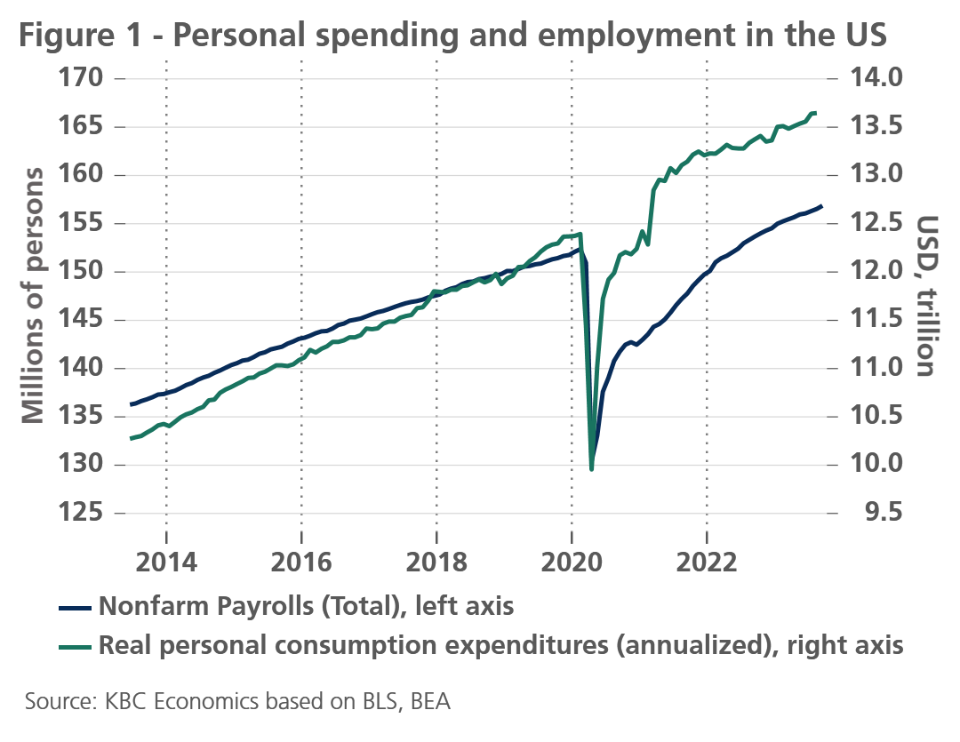
The strongly performing labour market plays a key role in this. The latest labour market report illustrates this strength. In September, 336,000 new jobs were created, the largest increase since early 2023 (figure 1). Thanks to robust job creation, households can continue to consume buoyantly, underpinning economic growth. Indeed, despite very high real interest rates and increased gasoline prices, private consumption was the main driver of growth in the third quarter. In addition, non-residential investment and net exports also performed well.
However, maintaining this strong performance in the fourth quarter will be a major challenge. In addition to the abovementioned high real interest rates, which will inevitably start to weigh on investment growth, we see three more reasons for a growth slowdown. First, a significant part of the population will start repaying student loans in full again in October. This could act as a negative shock to private consumption. After all, a full monthly repayment represents 0.5% of personal spending. Secondly, the major carmakers in the US (Ford, GM and Stellantis) have been facing a targeted strike by the (UAW-affiliated) unions since late September. The five companies involved represent ‘only’ 16% of US car production. But if the strikes last more than a month, they will undoubtedly have a negative impact on industrial production in the last quarter. Finally, the threat of failure to approve the government budget, leading to a government shutdown in the fourth quarter, continues to hinder growth of the US economy.
The closure of some government departments has now been avoided until mid-November. But the subsequent ousting of the Republican majority leader and Speaker of the House of Representatives in Congress is a warning that finding a political consensus for passing the budget will be very difficult even in November. While we do not expect a federal government shutdown to last long or to cause significant direct damage to the economy, the uncertainty surrounding this political issue could negatively impact business and consumer sentiment and thus indirectly hurt the economy.
Bottom line: given the many risks, the performance of the US economy in the coming months may not be as impressive as we have seen in the first three quarters of this year. That’s why we continue to see a significant slowdown in growth, which should approach de facto stagnation by the turn of the year and next year. Given recent strong growth, we have slightly raised our forecast for average real GDP growth for 2023 from 2.2% to 2.3%. But for 2024, we maintain our growth forecast of 0.9%.
Eurozone drifts between growth and contraction
Unlike the US economy, the eurozone economy remains lacklustre. Confidence remains weak, although the decline in business confidence seems to have stabilised somewhat in September. After months of decline, both the composite purchasing managers’ confidence index (PMI) and the European Commission (EC) indicator of business confidence rose very slightly in September: from 46.7 in August to 47.2 for the PMI and from -0.41 to -0.36 for the EC confidence indicator. That the decline has turned into a minimal increase is encouraging, although the levels remain significantly lower than during the spring (54.1 in April 2023 for the PMI, and 0.69 in January and February 2023 for the EC indicator).
The improvement was particularly noticeable in manufacturing, to a lesser extent in services, and not at all in construction. Most encouragingly, according to the EC’s survey, future expectations are becoming less gloomy, while it is the assessment of activity in the recent past that continues to fuel pessimism. This may indicate that a broad further economic downturn is not imminent and that the bottom of the growth slowdown is in sight.
At the same time, however, there remain reasons for concern, such as the further loss of confidence in the interest-rate-sensitive construction sector. Consumer confidence is also weakening again. In early 2022, immediately after Russia’s invasion of Ukraine, it suffered a sharp snap, from which it had been recovering since summer 2022. That recovery stalled in the summer of this year and reversed again recently, as consumers are increasingly concerned about the economic situation and their future financial situation. However, the labour market continues to resist the economic weakening well. The slight increase in the unemployment rate in July was reversed in August. The unemployment rate again reached 6.4%, which is an all-time low.
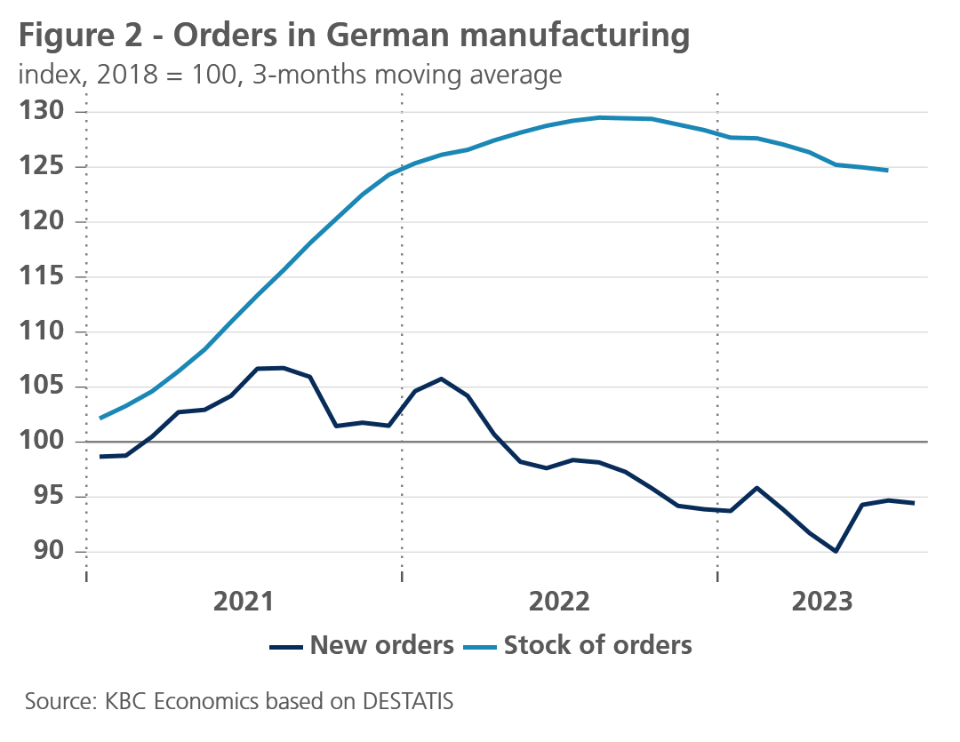
Concerns about German industry also remain undiminished. It has great importance for the German and, by extension, the European economy, and continues to go through heavy weather. According to surveys by the German research institute Ifo, German industry has yet to see an improvement in future expectations, while other sectors are at best showing signs of bottoming out. At the same time, the relatively high stock of unprocessed orders and the stabilisation - albeit at a low level - of new orders do not suggest a further sharp decline in industrial activity in Germany (figure 2).
So, all in all, the eurozone economy continues to drift on a blurred dividing line between growth and contraction. We expect this to remain the case for several more months. True, we assume that ECB rate hikes have come to an end (see below), but it will take a few more quarters for the economy to digest the effects of the recent monetary tightening. Our outlook remains unchanged. For the eurozone, we expect another three quarters (from the third quarter of 2023 to the first quarter of 2024) of weak economic growth, at or just above zero growth. For the German economy, we expect another slight contraction in the fourth quarter of 2023. During 2024, further inflation cooling will allow for a moderate recovery, supported by consumption. As a result, real GDP growth in the euro area would increase to 0.7% on average in 2024, after 0.5% in 2023.
Volatile energy prices
The oil price increase, which had started in early July, continued unabated until mid-September, driven by robust economic growth in the US and India. The reopening of the Chinese market after the pandemic had earlier boosted oil demand compared to a year prior, while oil prices also remained under upward pressure due to Saudi Arabia and Russia’s decision to cut oil supply by 1 million and 300,000 barrels per day, respectively. The imbalance between oil supply and demand led to big drops in oil reserves. US oil reserves fell nearly 7% in August. However, against the backdrop of rising long-term interest rates, the oil price boom came to an abrupt end in the first days of October (before the outbreak of violence in the Middle East). In barely a few days, the price of a barrel of Brent crude oil returned to its late-August levels (figure 3). The developments in the Middle East make the further development of the oil price very uncertain.
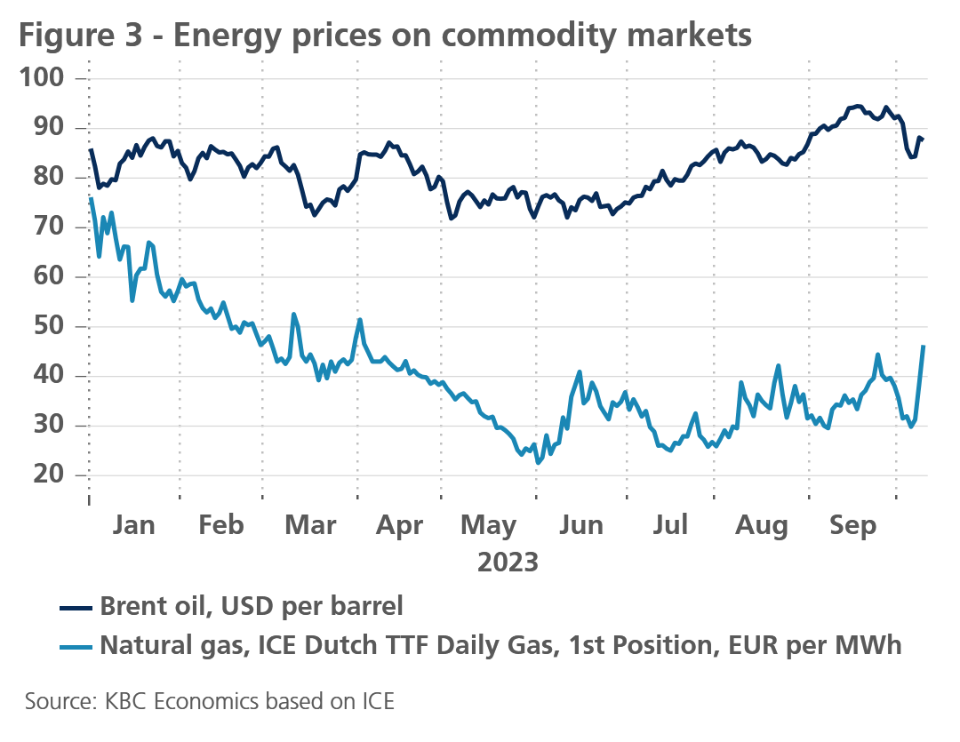
With winter approaching, European gas prices also climbed slightly higher in September: from an average of EUR 33.7 in August to an average of EUR 35.7 per MWh. However, the increase was mainly due to extended maintenance at Norwegian gas plants, which caused Norwegian gas exports to fall sharply. Prices had risen much more sharply in the summer due to strikes at two Australian Chevron-owned plants. Fortunately, the union and Chevron management reached an agreement on wages and conditions and the two-week strike ended. Meanwhile, the average European gas price in September 2023 was less than a fifth of its price a year earlier, thanks to lower consumption and the rapid replenishment of EU gas reserves (now filled to 96%), and made a downward correction in early October 2023, in line with the oil price.
Inflation falls in the US...
In the US, inflation remains on a downward path, with two potential troublemakers: volatile fuel prices and used-car (and possibly new-car) prices. Petrol and diesel prices clearly track oil prices. As a result, the negative contribution of the energy component to the annual increase in consumer prices is currently close to zero. The uncertainty about the near-term development of oil prices also makes the further course of petrol and diesel prices very difficult to predict. Nevertheless, higher energy prices are the main reason for the slight upward revision of our inflation forecasts for 2023 (from 4.1% to 4.2%) and for 2024 (from 2.5% to 2.6%).
As for core inflation, we maintain our outlook of a relatively benign path. In particular, services inflation - the inflation component on which monetary policy has the greatest impact - is evolving favourably, to the extent that it should reassure the Fed. Month-on-month increases, measured by the Fed’s measure of prices of personal consumption expenditures (PCE), have not only fallen back to their lowest level since 2020, but on an annualised basis, they are already below 2%. As wage growth is also slowing, we expect this favourable trend to continue.
The risk to core inflation comes in the next two quarters from strikes in the auto sector (see above). The fall in the price of second-hand cars during the summer months contributed significantly to the cooling of core inflation. However, the automotive sector strikes could halt this positive development. Indeed, inventories at car dealers are starting to fall again, and this could cause new price increases of used cars (and possibly new cars).
... and sharply in the eurozone
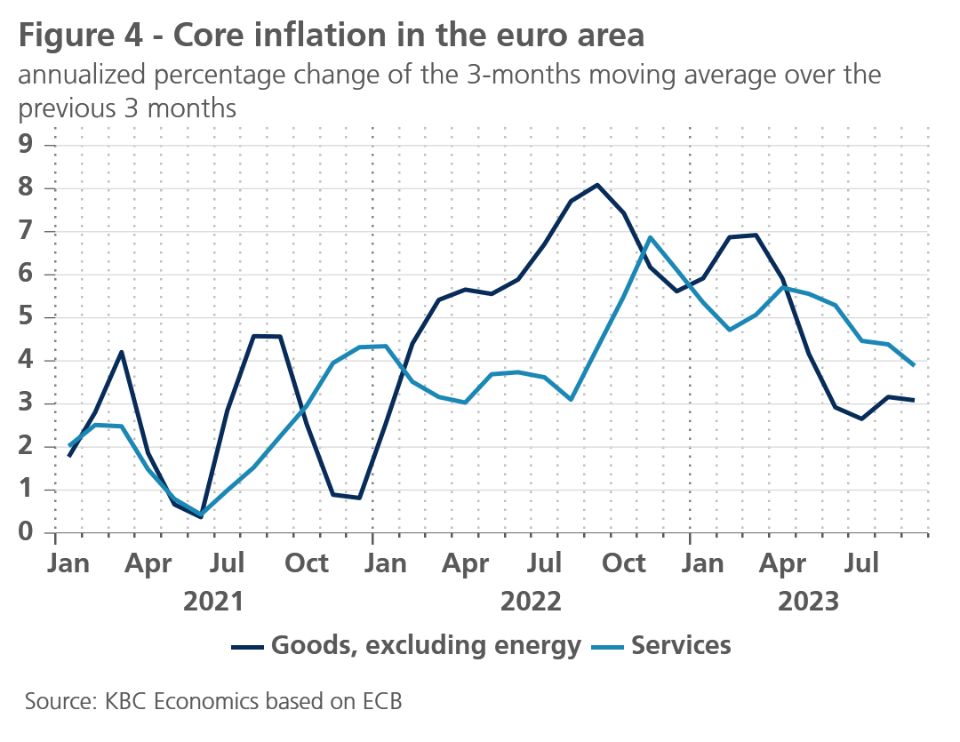
As expected, eurozone inflation fell sharply: from 5.2% in August to 4.3% in September. All major components contributed to the decline, meaning not only energy and food price inflation, but also core inflation, which declined from 5.3% to 4.5%. The cooling of goods inflation (excluding energy) has been ongoing for several months. Encouragingly, services inflation now also seems to have started a declining path. It fell from 5.5% in August to 4.7% in September. Also, the monthly rate of increase in service prices (after adjusting for seasonal variations) has now clearly slowed down again after the upward pressure in spring (figure 4). The cooling of core inflation is, as expected, gradual. However, recent figures suggest that the cooling may yet progress a little faster than previously estimated. We have therefore revised our forecast for core inflation slightly downwards for 2023 and 2024.
Another sharp further decline in overall inflation is written in the stars for October. This will mainly be due to energy price inflation, which will be sharply negative as prices are compared to October 2022 peak levels. This so-called base effect will drop strongly in November and especially in December, as energy consumption prices started falling sharply at the end of last year. Especially in December, eurozone inflation is therefore very likely to pick up again. However, this will only represent a temporary break in the downward trend. For 2024, we expect a further cooling, albeit at a much slower pace. The sharp disinflation we have seen in the course of this year has gradually phased out. We have revised our forecast for average expected inflation downwards from 5.7% to 5.6% for 2023 and from 3.1% to 2.9% for 2024.
Higher bond yields are here to stay
The most remarkable observation of recent weeks was the sharp rise of US and German government bond yields. This was not limited to the 10-year maturity but was reflected in a parallel upward shift of the whole yield curve. In our view, this rise was driven primarily by a sharp decompression of the term premium, which, according to New York Fed research, has now become positive again (figure 5).
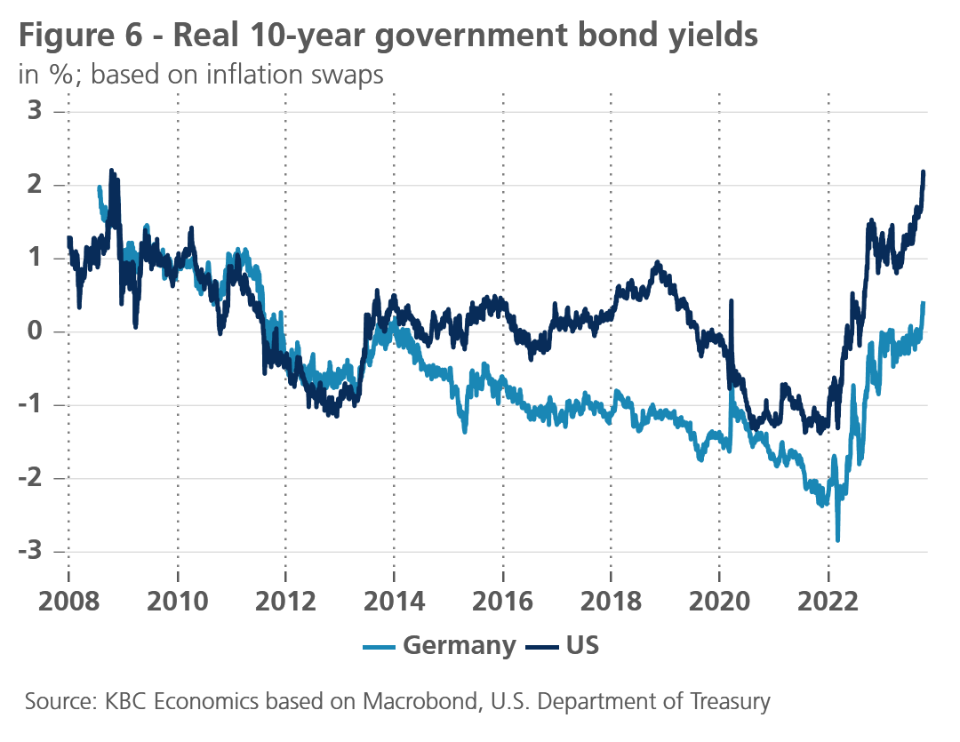
Moreover, it is worth noting that after the recent rise of both nominal and real yields (adjusted for swap-based inflation expectations), German real 10-year yields became positive again for the first time in almost a decade (figure 6).
The fact that the compression of the term premium coincided with the period after the start of the ECB’s Asset Purchase Programme (APP) suggests that the recent rise of the term premium is also related to the end of Quantitative Easing (QE). In our view, the decompression of the term premium in benchmark yields is indeed mainly driven by the ongoing Quantitative Tightening (QT) by both the Fed and the ECB. QT leads to an increased supply on the bond market, which, particularly in the case of the US, is amplified by the large public deficit to be financed. This demand-supply imbalance in bond markets leads to difficulties for the market to absorb the increased supply at current yields, which can only be solved by sharply higher yields. Moreover, in our view, this is not just a short-term phenomenon, but will remain an important market factor for as long as QT continues and the worsening US fiscal position persists.
The fact that the impact on bond yields was surprisingly large in the past weeks, is probably a reflection of the fact that the market consequences of QT, in terms of increased supply of bonds and withdrawal of liquidity, is non-linear in time. There appears to be a critical threshold beyond which the impact on yields accelerates. This is probably what we are observing now. The downgrade, in early August, of the best credit rating for the US by the rating agency Fitch has in all likelihood also played a role in this, especially as the political constellation in the US is not such that a fiscal consolidation can be expected in the short term.
Against the background of this fundamental change of the outlook, we have further lifted the level of the projected bond yield path for the US by about 50 basis points in the near term and for Germany by a parallel shift of about 35 basis points. The yield on US 10 years Treasuries is expected at 4.8% at the end of 2023, and to gradually decrease to 4.20% by the end 2024. For the 10 years German Bund yield we expect a level of 2.95% at the end of 2023 and still 2.75% at the end 2024.
End of ECB tightening cycle
The ECB increased its deposit rate to 4% in September. We confirm our view that the ECB deposit rate has reached its peak of this tightening cycle. A moderate start of the ECB rate-cutting cycle is only expected in the fourth quarter of 2024. This is slightly later than market expectations, but leads to the same deposit rate target for end-2024 of 3.75%.
Meanwhile, the ECB will continue its policy of unwinding its APP portfolio by not reinvesting assets that reach their maturities. This Quantitative Tightening runs in the background and can perfectly well continue when the monetary policy stance will be eased by cuts in the policy rate. Moreover, we expect the ECB to maintain its Pandemic Emergency Purchase Programme (PEPP) portfolio until well beyond the currently communicated minimal date of end-2024. The reason is the apparent effectiveness of the flexible reinvestment policy of the PEPP portfolio in containing intra-EMU sovereign spreads.
Intra-EMU spreads close to peak
Hence, we also confirm our view on intra-EMU sovereign spreads. They are probably close to their peak, with only limited upward potential. The three main reasons for our scenario of contained intra-EMU spreads remain valid: the end of the rate tightening cycle by ECB, the existence of the ECB’s Transmission Protection Instrument and the potential use of the flexible reinvestments of maturing assets of the PEPP portfolio. The remaining (very limited) upward potential for sovereign spreads stems from the fact that each month euro liquidity is absorbed by the ongoing run-off of ECB’s APP portfolio. In other words, excess liquidity in the system is decreasing. This reduces the ‘search for yield’ pressure exerted by investors on non-benchmark euro-denominated assets that has led in the recent past to a decompression of yield spreads.
The Italian spread was an outlier recently, driven by concerns that the latest fiscal plans of the Italian government may put public debt sustainability on a difficult trajectory. However, even the current Italian spread of about 200 basis points is still well below the 250 basis points limit that the ECB implicitly indicated as a maximum acceptable spread (i.e. beyond which the ECB may start to intervene one way or another).
Fed funds rate also at peak
After the Fed kept its policy rate unchanged at 5.375% in September, we expect that this is the peak of its rate cycle as well. In other words, we do not expect another rate hike in Q4 2023. However, there is more uncertainty about this than in the case of the ECB. The Fed is currently confronted with robust macroeconomic data, in particular from the labour market. Indeed, we upgraded both our growth and inflation outlook for 2023 to 2.3% (from 2.2%) and 4.2% (from 4.1%), respectively. Against this background, markets are not completely excluding the possibility of one additional and final rate hike at the November meeting (to 5.625%).
A main argument in favour of that would be that the Feds own ‘dot plot’ of September indicated that, with the information available at that moment, Fed governors (measured by their median projection) were indeed favouring an additional rate hike of 25 basis points. Since September, however, uncertainties about the economic outlook for the near term have increased. These include increased political uncertainty and the risks to economic sentiment from a renewed threat of a government shutdown. This adds to our conviction that the Fed will in fact not raise its policy rate any more in this cycle.
The Fed is likely to start easing its rate policy stance earlier than the ECB. We expect the cutting cycle to start from the third quarter of 2024, reaching a policy rate of 4.625% by the end of 2024. This is an upgrade by 50 basis points compared to our previous scenario, reflecting the robust macroeconomic data, the mentioned Fed ‘dot plot’ and the markedly increased expectations incorporated in Fed funds futures.
Similarly to the ECB’s APP policy, the Fed is expected to continue its balance sheet run-off (QT) at the current pace of about 95 bn USD per month (on average 60 billion USD of Treasuries and 35 bn of Mortgage Backed Securities). As is the case for the ECB’s APP, the Fed’s QT is likely to continue after the start of the easing cycle of its policy rates.
For now, interest rate support for dollar
The short-term interest rate differentials in favour of the US have led to an appreciation of the US dollar to 1.05 US dollar per euro. This rate differential will be the dominant driver until at least the end of 2023. From 2024 on, when markets have fully priced out any additional Fed rate hike, and the trough of the business cycle is gradually being passed, the euro is likely to regain ground against the US dollar again. Hence, we confirm our fundamental view that the US dollar is fundamentally overvalued against the euro at its current exchange rate.
All historical quotes/prices, statistics and charts are up-to-date, through October 9, 2023, unless otherwise noted. Positions and forecasts provided are those as of Oct. 9, 2023.