

Economic Perspectives June 2023
Read the full publication below or click here to open the PDF.
- Energy-related woes are fading. Gas prices declined by 30% in May, reaching 26 EUR per MWh. They have now declined 6 months in a row. On the supplyside, rapid expansion of LNG capacity and higher imports from Norway, Algeria and Azerbaijan put downward pressure on prices. On the demand side, higher renewable capacity, soft winter weather and energy savings by households and companies have kept reserves well-filled. Oil prices also declined by 4% to 72 USD per barrel, as concerns about the global economy mount. OPEC+ seems somewhat divided over future actions.
- Euro area inflation declined from 7% to 6.1% in May, thanks in large part to lower energy prices. Food price inflation remained elevated. Core inflation also declined from 5.6% to 5.3%. Both goods inflation and services inflation moderated. As this decline was expected, we maintain our 5.9% 2023 and 3.1% 2024 forecasts.
- US inflation data was mixed last month. Though CPI and PPI inflation declined markedly, PCE inflation increased from 4.2% to 4.4%. Lower gasoline prices and lower used car prices will put downward pressure on inflation, as will somewhat slower wage growth. However, higher 5Y inflation expectations of consumers could put upward pressure on inflation on a longer term. We hence downgrade our 2023 inflation forecast by 0.1 percentage point to 4.2%, while upgrading our 2024 forecast from 2% to 2.1%.
- As the debt ceiling saga has been resolved, central banks can again double down on fighting inflation. In the US, we expect the federal funds rate at 5.125%, but, in line with our previous projections, we don’t expect any rate cuts this year. QT will anyway cause further tightening in monetary conditions. In the euro area, the lower inflation print is unlikely to convince the ECB to stop hiking. We expect the deposit rate to peak at 3.75% in July.
- The euro area economy is feeling the pressure of increased monetary tightening. Producer sentiment indicators weakened across the board. Industrial production figures also weakened in April. Furthermore, the German and euro area GDP figures were revised downwards and both economies are now officially in recession. We hence lowered the average real GDP growth for the euro area by 0.1 percentage point for both 2023 and 2024 to 0.6% and 1%, respectively.
- The US economy averted calamity as both Republicans and Democrats found an agreement over the debt ceiling. The agreement includes minimal reductions in spending (0.2% of GDP next year). Nonetheless, its economic outlook remains worrying. Monetary tightening and tightening credit conditions will heavily weigh on US growth. We maintain our 1% and 0.1% forecasts for 2023 and 2024 respectively.
- In China, the post-Covid recovery is losing steam. Producer sentiment indicators weakened for both manufacturing and services in May. The real estate climate is also worsening as prices in the secondary real estate market stagnated. Low inflation leaves room for policy makers to loosen their policies, however. We downgrade our 2023 forecast from 5.4% to 5.3% and downgrade our 2024 forecast from 4.9% to 4.6%.
Calamity averted, but economic concerns are far from over
The global economy was being held hostage by US politicians in May. Some of them were willing to risk a ruinous default of the world’s biggest economy in order to score political points. Luckily, reason prevailed and an agreement to raise the debt ceiling for around two years was found, lifting the issue over the 2024 presidential election. That does not mean that the global economy is out of the woods yet. On the contrary, all major economies are showing signs of weakening. Producer sentiment indicators in Europe are weakening across sectors and countries. The German economy even officially entered in a recession. The US economy is also buckling under monetary pressure, while exports declined dramatically in April. Meanwhile the post-Covid recovery is losing steam in China, as industrial production, retail sales and fixed asset investments disappoint. The global economy thus avoided cardiac arrest, but is still chronically ill.
European gas prices back within historical range
Energy-related woes are fading. European gas prices posted their sixth monthly decline in a row. They declined by 30% in May, reaching 26 EUR per MWh. They are now 66% lower than a year ago. Though still higher than their historical averages of 20 EUR MWh, they are now well within their historical range. The rapid decline is due to a combination of factors. On the supply side, Europe’s LNG capacity expanded rapidly especially in German, while more piped gas was imported from Algeria, Azerbaijan and Norway. On the demand side, gas consumption has declined by 16% last winter versus the average of the 2019-2021 winters. Warmer than expected winter weather is estimated to explain a third of this decline. Other explanations include more structural elements like gas savings by companies and households and expansions of renewable energy capacity. Both the lower demand and new supplies helped Europe to defuse the energy crisis and allowed it to keep its gas reserves well-filled. At 70%, gas reserves are 20 percentage points higher than usual. As gas reserve refilling is usually a key driver of European gas demand over the summer months, prices have been pushed downwards (see figure 1). Though futures markets still expect prices to rise to above 40 EUR per MWh by end of this year, severe energy disruptions next winter look very unlikely.
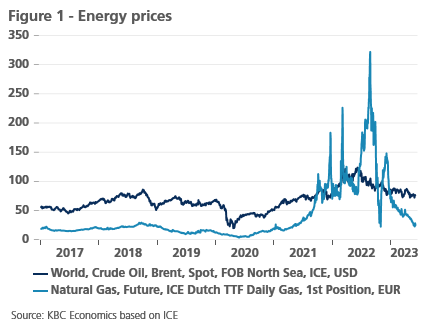
Gas prices aside, oil prices also declined by 4% to 72 USD per barrel. Fears of weakening global demand was the prime driver of this decline. Meanwhile, the market remains well supplied as non-OPEC members are partly compensating for the recent OPEC supply cuts. The recent OPEC decision to cut supply by 1 million barrels per day in July could put some upward pressure on oil prices in the coming month. Energy commodities, aside, other cyclical commodities such as copper also declined last month.
Euro area inflation falls
In the euro area, inflation fell to 6.1% in May. This is significantly lower than the April figure of 7%. All major inflation components contributed to the decline. Consumer prices for energy products were 1.7% lower in May than a year earlier. Since peaking in October 2022, the decline has already been 13.5%. With the recent and expected development of wholesale oil and natural gas prices, a further and even sharper decline in energy price inflation is on the horizon. Although food price inflation decreased by a full percentage point, it still remained particularly high at 12.5%. Here, too, the trend in commodity and wholesale prices shows a cooling trend, although this deceleration is expected to be much slower than for energy price inflation.
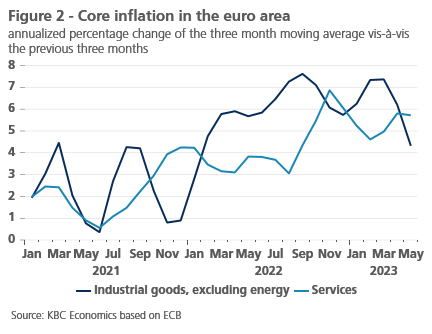
Most closely watched at the moment, however, is core inflation. That slowed from 5.6% in April to 5.3% in May. The slowdown in the rate of price growth of non-energy goods, which began to emerge in February-March, was confirmed in May. At 5.8%, the annual rate of increase was then a full percentage point lower than last February. That the acceleration in services inflation of previous months did not continue in May is also encouraging (see figure 2). Services inflation fell to 5.0% in May from 5.2% in April. However, it remains to be seen whether this has broken the upward pressure on services inflation. After all, the drop in May was also caused by the one-off factor of the introduction of a cheap ticket for public transport in Germany.
All in all, May’s inflation figures were in line with our expectations. We therefore left our estimate for expected annual average inflation in 2023 and 2024 unchanged at 5.9% and 3.1% respectively.
Latest US inflation data is mixed
Data on US inflation was mixed last month. On the positive side, US Consumer Price Inflation (CPI) was down by 0.1 percentage point for both headline and core inflation in April, reaching 4.9% and 5.5% respectively. Especially lower food price inflation and slowing shelter price inflation were encouraging in the report. Producer Price Inflation (PPI) also declined from 2.7% to 2.3%. Import prices were up by a higher than expected 0.4% in April, but this was largely compensated by a 0.2 percentage point downward revision of the March import prices. Furthermore, business surveys also indicated that price pressure is moderating, especially in the manufacturing sector. There was also positive news for car enthusiasts. Gasoline prices declined by 2% in May as did used car prices (based on the Manheim Index). Finally, there are indications that wage growth is moderating. Average hourly earnings increased by 0.3% month-on-month in May, down from a 0.4% increase last month. The lower wage pressure is expected to eventually lower pressure on services inflation.
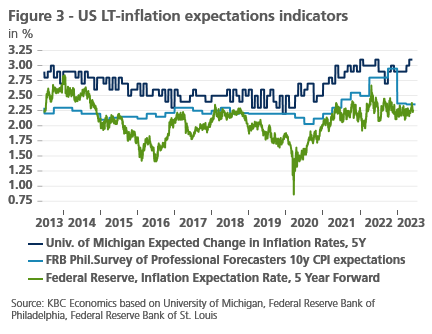
There was unfortunately also some bad news. The Fed’s preferred metric of inflation, PCE inflation, increased from 4.2% to 4.4% in April, while core PCE inflation increased from 4.6% to 4.7%, in large part driven by goods inflation. Five-year inflation expectations in the Michigan Index also increased, though expectations of institutional players remain well anchored (see figure 3). All-in all, we downgrade our 2023 inflation forecast by 0.1 percentage point to 4.2%, while upgrading our 2024 forecast from 2% to 2.1%.
US and EU monetary policy will probably start to diverge soon
Based on the sticky core inflation in the euro area, which remains for now above the ECB’s medium-term inflation target, we maintain our view that the ECB will raise its policy rates twice more by 25 basis points each time. This will bring the deposit rate to its terminal rate of 3.75% in July. The first rate cut is only expected from the second half of 2024 on. In the meantime, from Q3 2023 on, the ECB will stop the reinvestment of all the maturing securities of its APP portfolio, which will moderately increase the pace of its ongoing Quantitative Tightening (QT) from currently on average 15 bn EUR to about 20-25 bn EUR per month.
The outlook for the Fed’s rate policy is more uncertain and much more data-dependent. On the one hand, high and sticky core inflation together with strong labour market performance support the case for raising the policy rate further. On the other hand, weakening forward-looking indicators and our expectation that the US economy will enter into a technical recession from the second half of 2023 are likely to motivate the Fed governors to take a pause and wait for further information about the inflation trajectory. While market expectations are very volatile, we maintain for the time being our expectation that the Fed’s policy rate has reached its peak at its current rate of 5.125%. We expect the Fed to start its rate cutting cycle from the first quarter of 2024 on. This rate cycle will take place against the background of the Fed’s ongoing QT program of 95 bn USD per month, which helps to tighten monetary conditions, cool the economy and bring (core) inflation down closer to its target. Interest rate risk remains elevated and tilted to the upside, however, as the probability of the alternative ‘skip-one-hike’ scenario is not marginal.
At this stage, bond markets are pricing in a Fed scenario that is broadly in line with our scenario described above. Accordingly, US bond yields are also in line with our expectations. We therefore maintain our view that the US bond yields will peak at 3.70% at the end of Q2 2023 and will moderately decrease to 3.60% at the end of 2023. On the other hand, we revise downward the expected peak level of German bond yields to 2.50% (from 2.70%) at the end of Q2 2023. We expect the yield to remain at that level for the remainder of this year. The reason for the more limited upward short-term potential of the German yield is the broad market consensus about the next steps by the ECB, which therefore are probably largely priced in into the current yield. Moreover, the German long-term real bond yield (based on market implied euro area inflation expectations) does not move into positive territory (in contrast to the US), which suggests that for the time being some more structural factors may be preventing nominal yields to rise above inflation expectations.
We continue to expect the EUR to appreciate against the USD during the forecasting horizon, mainly based on its estimated undervaluation. However, this path starts from a lower level given the recent strengthening of the USD.
As we near the end of the rate hike cycles, we expect bond markets to converge relatively fast to the new equilibrium. Therefore, we expect intra-EMU sovereign spreads versus Germany to remain broadly stable around their current levels. The ECB’s rate hiking cycle is coming to an end and the trajectory for the rundown of the ECB’s APP portfolio has probably been largely priced into current spread levels. Moreover, European bond markets appear to be sufficiently reassured by the existence of the ECB’s Transmission Protection Instrument (TPI), and the flexibility of reinvestments of maturing securities in the ECB’s PEPP portfolio.
Germany and euro area in recession after all
Revised figures for German GDP in the first quarter of 2023 now indicate that the German economy did go into recession during the winter of 2022-2023. Instead of previously estimated zero growth, the figures now show a contraction in real GDP of 0.3% compared to the fourth quarter of 2022. The sharp decline in both household and government consumption accounted for this, despite increases in exports and investment. Since there was also a contraction of real GDP in the fourth quarter of 2022 (by 0.5% compared to the previous quarter), there are two consecutive quarters of negative economic growth, in other words, a technical recession. The euro area real GDP growth rate was revised downward from 0.1% to -0.1%, while the zero growth rate for the fourth quarter of 2022 was also lowered to -0.1%. So, also the euro area is in recession.
Nonetheless, the decline in manufacturing output in March suggests that the euro area economy is going through tougher weather than it looked until recently. The malaise may not be as severe as the sharp 5.9% drop in production compared to February suggested, however. After all, that strongly negative figure was heavily driven by the halving of production in the computer, electronics and optical products sector, presumably located mainly in Ireland. There, macroeconomic figures are prone to being distorted by operations of multinational companies that have little or nothing to do with local economic activity. The month-on-month growth rates for the other industrial sectors in the euro area range from +0.5% to -2.4%. So they are weak indeed, but not as weak as the global figure suggests.
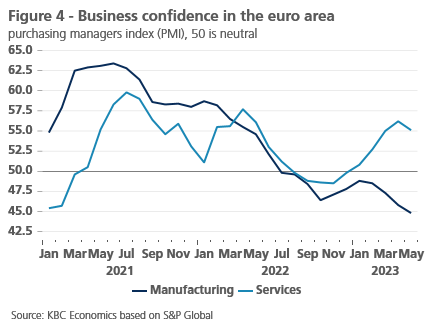
Moreover, these figures are in line with the deterioration in sentiment in the manufacturing sector that has already been reflected in confidence surveys in recent months. Confidence in the manufacturing sector continued to weaken in May, even to a fairly strong degree (see figure 4). The Purchasing Directors’ Confidence Indicator (PMI) fell significantly below the 50 threshold associated with the difference between expansion and contraction. The European Commission’s indicator of confidence in manufacturing also fell sharply and is now just below its long-term average. Moreover, the loss of confidence in manufacturing seems to be spilling over to the service sectors. Since the turn of the year, the Purchasing Directors’ Confidence Indicator (PMI) in service sectors had been steadily improving and the European Commission’s services confidence indicator held steady at a high level. But both showed deteriorating conditions in May. A loss of confidence – rather slight for now – is also becoming increasingly apparent in construction.
All this means that the recent unexpectedly favourable development of energy prices does not sufficiently counterbalance the negative economic impact of the internationally uncertain environment and the tightening monetary environment. We have therefore slightly lowered our growth forecast for the second quarter of 2023 to be in line with the expectation of very weak growth of less than 0.5% year-on-year for the second half of the year. A sharp economic downturn remains rather unlikely given the labour market’s strong performance for now. Thanks in part to the positive spillover effect of growth in 2022, this brings the expected average annual growth rate for real GDP in 2023 to 0.6% (0.1 percentage point lower than our previous forecast). A slight firming of growth in 2024 would bring the average growth rate to 1.0%, instead of the previously projected 1.1%.
The US economy avoids default, but outlook remains uncertain
All economic news was overshadowed by the debt ceiling negotiations in May. Failure to raise it would have disrupted the financial system and imposed steep budget cuts. That would have triggered a deep recession (see our KBC Economic Opinion of 3 May). Luckily, this calamity was averted. Democratic President Joe Biden and Republican House Speaker Kevin McCarthy reached an agreement to lift the debt ceiling until early 2025. It passed both chambers and was signed by President Biden on 3 June. The agreement also included a.o. a cap on non-discretionary spending (at 2023 levels), the rescinding of unspent pandemic funds and lower funding for the Internal Revenue Services (IRS). All in all, the deal is estimated to cut spending by 0.2% of GDP next year. Its impact on the economy will thus likely be limited.
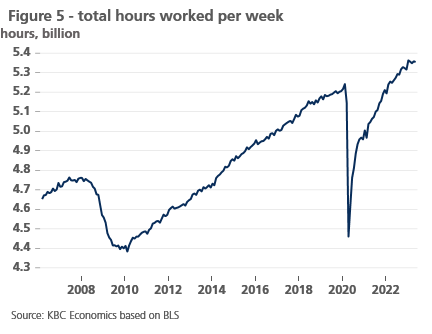
This limited impact is welcome news for an economy which is increasingly feeling the pressure of monetary tightening. This pressure was evident in the latest data. Most notable was the recent deterioration of the goods trade balance in April. The goods deficit increased by a stunning 17%, as exports markedly dropped. The marked drop in exports stands in stark contrast to consumer spending, which increased by a healthy 0.8% month-on-month in April. The labour market reports also provided mixed messages. On the one hand, payrolls increased by a robust 339.000 in May, while payrolls in prior months were revised upwards by 93.000 and job openings unexpectedly increased in April. On the other hand, the unemployment rate increased by 0.26 percentage point to 3.7%, while average hours worked declined by 0.1 hour to 34.3 hours. The recent declines in average weekly hours seriously hinder the productive capacity of the US. Notwithstanding the strong payroll figures, total weekly hours worked have been on the decline since January (see figure 5).
Forward-looking indicators paint a troubling picture. Consumer confidence surveys were down significantly, though this might partly be related to the debt ceiling debacle. Manufacturing surveys also deteriorated markedly and are now clearly in contractionary territory. This is in contrast to the service sector, which remains in expansionary territory. The most troubling survey data came from loan officers. The survey showed both a severe tightening of credit conditions and lower demand for most types of loans. The picture for commercial real estate is especially worrying.
Given the mixed soft data, relatively prudent monetary policy and tightening credit standards, we maintain our cautious outlook on the US economy and keep our 2023 and 2024 forecasts unchanged at 1% and 0.1% respectively.
China’s post-Covid recovery weakens
Compared to last month, we have become less optimistic about China’s growth prospects. After unexpectedly strong real GDP growth in the first quarter, an increasing number of signs suggest that the reopening will fade out faster than previously thought. The April figures for industrial production (5.6% year-on-year), retail sales (18.4% year-on-year) and fixed investment (4.7% year-on-year for the January-April period) were positive but lower than expected. Business confidence in the services sector still points to an expansion but weakened unexpectedly in May (54.5). In the manufacturing sector, confidence sank further into restrictive territory (48.8), according to the NBS PMI report. We therefore lower our growth outlook for 2023 to 5.3% year-on-year.
The surprisingly fast weakening of economic activity is likely partly due to the services intensity of the recovery. Contact-intensive services have been most affected in recent years by the very strict restrictive measures aimed at curbing the spread of the Covid virus. Consequently, after the release of the zero-Covid policy, it were mainly these sectors that supported the recovery in the first months of 2023. This is exceptional for China as recovery waves in the past have typically relied heavily on investment, including from the government side. Services-based recoveries are typically more intense but they also fade out faster. This is due to the fact that service demands are typically met immediately by one provider (with low upstream multipliers) while investment happens with providers that are part of a network of interlinked suppliers, so demand shocks eventually (and with some delay) trickle down to multiple providers.
The fact that investment is contributing less to China’s growth revival in this recovery is partly due to problems in the real estate sector and increased concerns about local government debt. Foreign investment is also at a low level, partly because of increased geopolitical tensions with the West and global monetary tightening. Meanwhile, the impact of stimulus measures to fight the pandemic has also quietly worn off. For now, no new fiscal support measures have been announced but this could change later this year, especially if the government’s 5% growth target is at risk. Further monetary easing is also likely, initially via the provision of liquidity to banks and by lowering the Reserve Requirement Ratio. We do not expect a reduction in the Medium-Term Lending Facility Rate in the near-term but continued weak economic growth could affect this scenario. April’s low inflation figures (headline at 0.1% year-on-year and core inflation at 0.7% year-on-year) leave ample room for the central bank to ease rates if it is deemed necessary to support the economy. Because of the weaker price dynamics at the start of the second quarter, we have adjusted our forecast for headline inflation downwards to 1.8% year-on-year for 2023.
All historical quotes/prices, statistics and charts are up-to-date, through June 5, 2023, unless otherwise noted. Positions and forecasts provided are those as of June 5, 2023.