

Economic Perspectives February 2023
Read the full publication below or click here to open the PDF.
- In January, the downward trend in European natural gas prices continued with a decrease of 27% to 57 EUR per MWh. In the last two months alone, gas prices have fallen by 61%. Meanwhile, Brent oil prices remained relatively stable at 86 USD per barrel. The price of other important commodities, like copper, tin, iron ore and lumber, increased strongly in January on the back of subdued recession fears and growing optimism about the reopening of the Chinese economy.
- Headline inflation in the euro area decreased to 8.5% in January coming from 9.2% in December. The main driving force behind the deceleration is a drop in energy inflation from 25.5% to 17.2%. Thus, the disinflationary process in headline inflation seems underway. However, core inflation has yet to start that process as it remained unchanged at 5.2%. We maintain our average euro area inflation forecast of 5.4% in 2023 and 3.0% in 2024.
- The US inflation print posted a larger than expected 0.5% month-on-month increase in January, bringing year-on-year inflation to 6.4%, down from 6.5% in December. The month-on-month inflation was broad-based and elevated across multiple components such as energy, food, services and shelter. Unfortunately, leading indicators show continued inflationary pressures in certain categories, such as shelter and used cars & trucks. A lower dollar, high wage pressure and higher commodity prices will also keep inflationary pressures elevated. Therefore, we upgraded our 2023 average inflation forecast by 0.3 percentage point to 3.8%.
- The Fed and the ECB decided to further raise interest rates by 25 basis points and 50 basis points respectively. Furthermore, the ECB committed to an additional 50 basis points rate hike in March and they also confirmed the start of quantitative tightening at an average pace of 15 billion euro per month from March onwards. Both central banks underscored the higher-for-longer view in order to bring down (core) inflation. We maintain our forecast, in line with central bank communications, that the ECB deposit rate and the Fed policy rate will peak in Q2 2023 at 3.5% and 5.375% respectively.
- The decline in European natural gas prices gave the euro area economy some breathing space as the risk of protracted and critical energy shortages over winter has further decreased. In Q4 2022, GDP increased by 0.1% quarter-on-quarter. Given the earlier than expected positive developments concerning energy prices and the reopening of China, together with a resilient US economy, we have upgraded our forecast for H1 2023. In contrast, we downgraded our forecast for H2 2023 as we expect an increasing effect of restrictive monetary policy on the economy. We forecast real GDP growth to be 0.8% in 2023 and 1.1% in 2024.
- For now, the US economy appears to resist the pressure coming from restrictive monetary policy. In Q4 2022, GDP increased by 0.7% quarter-on-quarter (2.9% annualised) in large part thanks to higher inventories. The labour market remains strong as well with a jobs gain of 517k in January. Nonetheless, we do not expect the US economy to be able to hold off the pressure of monetary tightening forever and therefore forecast a technical recession in H2 2023. We upgraded our 2023 forecast by 0.3 percentage point to 1.2% and downgraded our 2024 forecast by 0.2 percentage point to 0.9%.
- As the Chinese government has abandoned zero-Covid, the reopening of the Chinese economy becomes apparent through a strong rebound in PMIs, reflecting that economic activity is back in expansionary territory. We upgraded our real GDP growth forecast for 2023 from 4.4% to 5.0% and downgraded our forecast for 2024 from 5.1% to 4.7%. We also raised our average inflation forecast for 2023 to 2.3%.
No contraction in Q4 2022
In January, global economic sentiment improved as recession fears have somewhat subsided. In the euro area, a further rebound in PMIs reflects the current optimism driven by lower natural gas prices. Already in Q4 2022, the euro area economy was stronger than expected and avoided contraction with a GDP growth of 0.1% quarter-on-quarter. In 2023, the main challenge is most likely core inflation. It is definitely above target but not completely out of control. The ECB policy rate should be above the neutral rate by now, thus in restrictive territory, putting pressure on the economy in general in order to lower core inflation. In the US, the disinflationary process is underway, pushing the Fed away from extreme hawkishness. This lowers the risk that they would “over-hike” interest rates. Despite current restrictive monetary policy, the US economy performed relatively well in Q4 2022 with a GDP growth of 0.7% quarter-on-quarter (2.9% annualised). In China, the worst of the Covid-wave seems to have passed and herd immunity appears close to being achieved. Nonetheless, the surge of infections was a drag on growth in Q4 2022 with zero growth. However, given the improved Covid-situation and the already faster than expected reopening of the Chinese economy, the growth prospects for China have become more positive.
Nonetheless, despite improved sentiment, global growth is likely to remain below potential as the peak impact of higher interest rates is not yet achieved. Furthermore, downside risks remain elevated. The current renewed optimism could quickly disappear because of a.o. a further escalation in the war between Russia and Ukraine, increasing US-China tensions or a budget stand-off in the US.
Copper on the rise
A more supportive global economic environment, together with some supply disruptions in Latin America, has put many commodities on an upward trajectory. In particular, the reopening of China, the most important commodity importer in the world, has upended commodity markets (see figure 1). Copper, a crucial metal for the global economy and a leading indicator for economic activity, has increased by 11% in January to 9279 USD per Metric Ton, a 31% increase compared to its July low. Similarly, iron ore and lumber increased by 10% and 37% respectively in January. The most notable increase was the price of tin, a key input for microchips and solar panels, which increased by 17% in January and is now 67% above its November low.

In contrast to these commodities, European natural gas prices decreased by 27% to 57 EUR per MWh in January after an already strong decline in December. In the past two months alone, gas prices have dropped by 61%. The main reasons for the downward trend in prices are relatively mild weather conditions and well-filled European gas reserves. On 31 January 2023, the fill level in Europe was 72%, significantly higher than what can be expected at this time of year. The average fill level on 31 January over the period 2011-2021 was only 56%. Meanwhile, Brent oil prices remained relatively unchanged at 86 USD per barrel at the end of January, not yet benefitting from the reopening of China because of an apparent oversupply and increasing inventories, especially in the US.
Euro area inflation falls
In the euro area, inflation fell from 9.2% in January 2023 to 8.5% in February, according to Eurostat’s flash estimate. The drop is exclusively due to the decrease of energy price inflation from 25.5% to 17.2%. Food price inflation and core inflation (which excludes energy and food prices) stabilised at around 14% and 5.2% respectively. The reported figures are in line with our expectations. We have therefore not changed our outlook for the time being. Headline inflation will decrease swiftly in the course of 2023 on the back of lower energy price inflation, but core inflation will decrease only gradually. As a result, headline inflation will still average 5.4% in 2023.
However, uncertainty about inflation trends remains high. Even a first estimate of realised inflation was delayed in Germany due to technical problems. There is thus a real chance that the final figure for the euro area will still be revised. The overall only small drop in the – in the meantime with a delay published – preliminary figure for Germany (from 9.6% to 9.2% on the basis of the harmonised consumer price index) suggests that this could be an upward revision. On the other hand, the recent fall in European gas and electricity prices and the (expected) higher weight (2023 compared to 2022) of energy prices in the consumer price index increase the likelihood that the inflationary cooling in 2023 would be somewhat more pronounced, than currently anticipated in our forecast.
US inflation surprises to the upside
Though the US has passed peak inflation last summer, the January print showed inflation pressures are far from over and that the road to 2% inflation is long and bumpy. In January, inflation increased by 0.5% month-on-month, bringing year-on-year inflation down to 6.4%, a 0.1 percentage point decline compared to December. Core year-on-year inflation also declined by 0.1 percentage point to 5.6%. Month-on-month inflation increased across multiple components. Food inflation increased by 0.5% month-on-month, bringing it to 10.1% year-on-year. Energy inflation posted its first monthly increase since June, bringing it to 8.7% year-on-year.
Shelter inflation remains very elevated, increasing by 0.7% month-on-month in January. Unfortunately, this high shelter inflation is likely to last in 2023. Since January 2020, the Zillow Observed Rent Index (ZORI), a leading indicator for rents, rose by 25%, while the stickier shelter component of the CPI only increased by 14%. Hence we expect continued upward rent price pressure in 2023. Shelter inflation aside, services inflation less shelter ticked up by 0.6% month-on-month, driven in large part by higher wages. As the labour market remains tight, the Employment Cost Index increased by 5.1% in 2022.
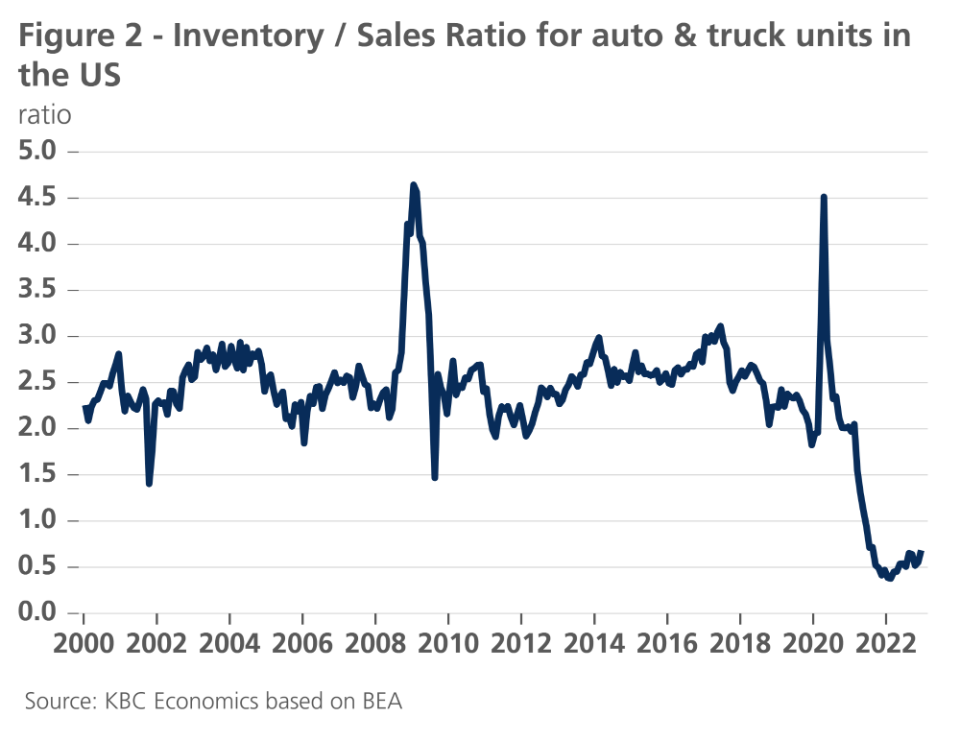
Goods inflation (less food and energy), remained low this month, posting a 0.1% month-on-month rise. The low figure was mainly driven by the used cars & trucks component. Without used cars & trucks, goods inflation increased by 0.5% month-on-month. Unfortunately used cars & trucks are unlikely to keep goods inflation down this low in the coming months. The Manheim Used Vehicle Index, a leading indicator for the used cars & trucks component of the CPI ticked up by 0.8% and 2.5% in December and January respectively. As US inventories of cars and trucks remain exceptionally low, further price rises can be expected in this important category (see figure 2).
Furthermore, higher commodity prices and a lower dollar will cause further upward pressure across many CPI components, as will high wages. Therefore, we upgraded our 2023 inflation forecast by 0.3 percentage point to 3.8%. We still expect inflation to return to the 2% target in 2024, given the Fed’s continued tightening policy.
The rate hike cycle continues
At their latest policy meetings in the beginning of February, the Fed and the ECB increased their policy rates by 25 and 50 basis points respectively. This brought the Fed policy rate to 4.625% and the ECB’s deposit rate to 2.5%. In addition, the ECB confirmed the start of a very moderate quantitative tightening of its APP portfolio from March onwards, at an average pace of 15 billion euro per month. This pace will be recalibrated after the second quarter, when the impact on financial markets becomes clearer.
The ECB’s rate hike by 50 basis points was expected, as well as the ECB’s de facto commitment to raise the deposit rate again by 50 basis points at its next policy meeting in March. After that, and consistent with the ECB’s communication that their policy will become more data-dependent, we expect the ECB to slow down the pace of tightening to steps of 25 basis points, reaching the peak of the current rate cycle in the second quarter at 3.5%.
The Fed, on the other hand, slowed down the pace of rate hiking to 25 basis points in early February. However, in line with the Fed’s communication, we continue to expect the peak in the current rate cycle to be at 5.375% in the second quarter. This implies three more rate hikes of 25 basis points, one more in the first quarter and two more in the second quarter. At that stage, both for the ECB and the Fed, the policy rates will be clearly at restrictive levels. This is broadly in line with current money market expectations.
In their communication, both the Fed and the ECB also confirmed their determination to ‘stay the course’ and bring inflation down. Despite falling headline inflation as a result of easing energy prices, core inflation remains a matter of considerable concern. Both central banks therefore maintained a hawkish tone, confirming the higher-for-longer view and stressing the need to bring policy rates sufficiently deep into contractionary territory to bring inflation timely back on a structurally downward path. Fear of persistent core inflation dynamics clearly underpins central banks’ policy stances in terms of rate setting and communication. As we see core inflation deceleration as a slow process, we expect the first rate cut for the Fed and the ECB only in the second half of 2024, which is later than markets currently expect.
Long-term bond yields only rose moderately after the central banks’ decisions, despite the very hawkish central bank communication and guidance. Against the backdrop of perceived easing of near-term risks, financial markets remain in a risk-on mode for the time being. This risk-on mode is not only reflected in bond yields, but also in risk premia in general, as well as in the market expectation that central banks (in particular the Fed) will start decreasing policy rates much earlier than currently communicated. The anticipation of a frontloaded pivot causes significant inversion in yield curves and a clear discrepancy between long-term market yields and those implied by central banks’ guidance.
The current market risk-on mode is probably exaggerated and therefore only temporary. Although the risk of a slower monetary policy tightening pace cannot be ruled out, we maintain the view that central banks want to restore their credibility at all costs. They are therefore determined to implement their forward guidance in terms of the likely peak level of the policy rate and the time needed to get (core) inflation under control. Therefore, a near-term re-alignment of market expectations with central banks’ guidance is likely. We expect both the US and German 10 year bond yields to increase from current low levels, albeit to a somewhat lesser extent than we had forecast last month. We expect the yield curve to remain significantly inverted at least throughout 2023 and probably well into 2024, with the 10 year yield reaching the cyclical peaks in the second quarter of 2023 at 4.35% and 3.00% in the US and Germany respectively (i.e. a downward revision of last month’s forecasts from 4.75% and 3.25% respectively), coinciding with the expected peak of the respective policy rates.
The near end of the current risk-on mode on financial markets is likely to lead to a strengthening of the dollar against the euro. However, in the course of the second half of 2023, the euro is likely to bottom out and start gradually appreciating again as the end of the expected growth slowdown will gradually be priced in. Nevertheless, the euro is expected to remain below its fundamental fair value exchange rate throughout at least the whole of 2023.
Persistent resilience in the euro area
The expected Q4 2022 euro area contraction has not materialised. According to the flash estimate, real GDP was 0.1% higher than in the previous quarter, albeit thanks (again) to particularly strong Irish GDP growth (+3.5%). Besides Belgium, France and Spain, among others, recorded modest growth of 0.1% and 0.2% respectively. GDP did contract in manufacturing-heavy Germany (-0.2%) and Italy (-0.1%), but less than expected.
Nonetheless, compared to growth in the second (0.9%) and third (0.3%) quarters, real GDP growth of 0.1% in the fourth quarter represents a significant slowdown. The decrease of household consumption is a major cause of this. The loss of purchasing power due to inflation has clearly halted pent-up demand after the Covid-19 pandemic. It is notable though that, similarly to the pandemic, and again with considerable fiscal policy support, euro area economies responded more resiliently than expected to the energy crisis and the loss of confidence at the outbreak of the war in Ukraine. Annual average real GDP growth for the whole of 2022 is now estimated at 3.5%. This is in line with our expectation at the start of 2022. We lowered that forecast in the months following the outbreak of the war to 2.1% in May. But from then on, following the publication of repeatedly surprisingly positive figures, we gradually increased our forecast to 3.3% in January 2023. The current estimate is even slightly better.
A prime reason for this renewed optimism were lower natural gas prices, which, while still two to three times higher than before the energy crisis, are now lower than a year ago. Uncertainty remains, but it increasingly looks like major supply problems will not occur this winter and the risk of major shortages for next winter has also been seriously reduced. Against this backdrop, both consumer and producer confidence has continued to improve. Together with the earlier-than-expected reopening of the Chinese economy and the currently still somewhat stronger-than-expected US economy, this suggests that also in the euro area, the economy will remain more buoyant during the first half of 2023 than thought until recently.
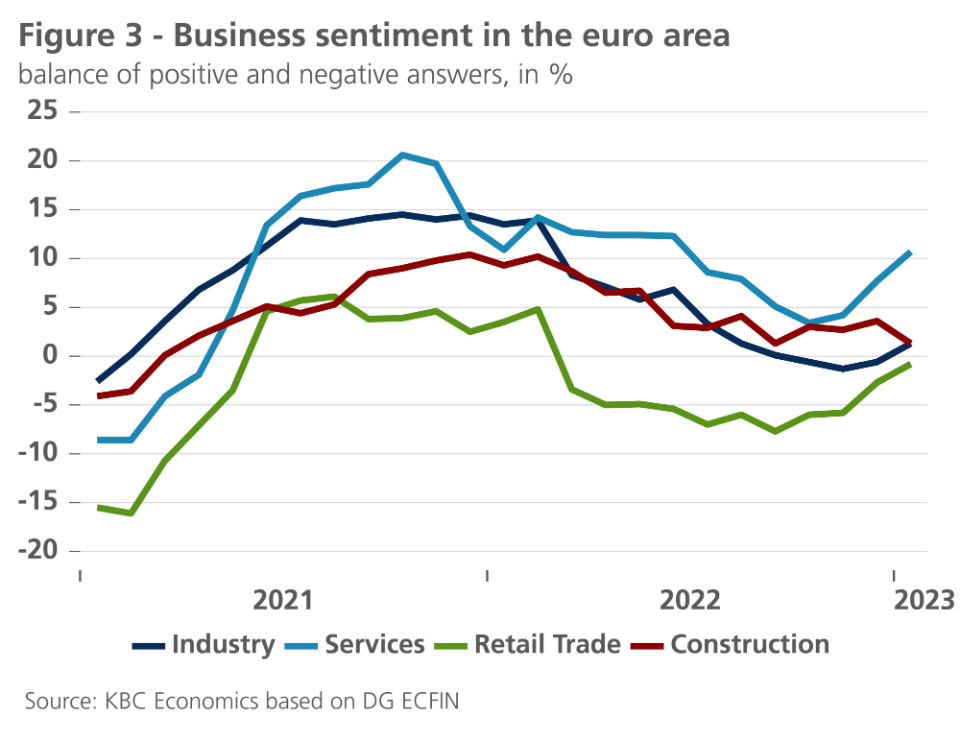
At the same time, there are also signs that the ECB’s tighter monetary policy will start to weigh on economic growth. In the interest-rate sensitive construction sector, the improvement in confidence lags behind that in other sectors (see figure 3). According to the European Commission’s economic confidence indicator, this sector is even experiencing some deterioration. For private residential construction in particular, a sensitive slowdown seems to be in the making. The ECB survey of 151 euro area banks in the period from late December to early January reported the strongest decline in demand for home loans since the survey was launched 20 years ago. Corporate credit demand also eased, mainly due to higher interest rates and lower investment credit needs. Other indicators are more reassuring, so no immediate sharp drop in investment or construction activity should be feared. But as monetary tightening has not yet ended and is only impacting the economy with a lag, we take into account that the second half of 2023 and probably also the beginning of 2024 will see somewhat lower economic growth than expected so far. The expectation that the US economy will then go through a mild recession also contributes to dampen our expectations for the euro area economy in the second half of the year.
In summary, we have raised our growth projections for euro area real GDP in the first half of 2023 and lowered them for the second half of 2023 and early 2024. Together with the larger spillover from 2022 to 2023 - a consequence of stronger-than-expected growth in the fourth quarter of 2022 - this raises the expected average real GDP growth for 2023 from 0.4% to 0.8%. However, expected growth for 2024 is lowered from 1.4% to 1.1%.
The US economy is resisting monetary tightening pressure (for now)
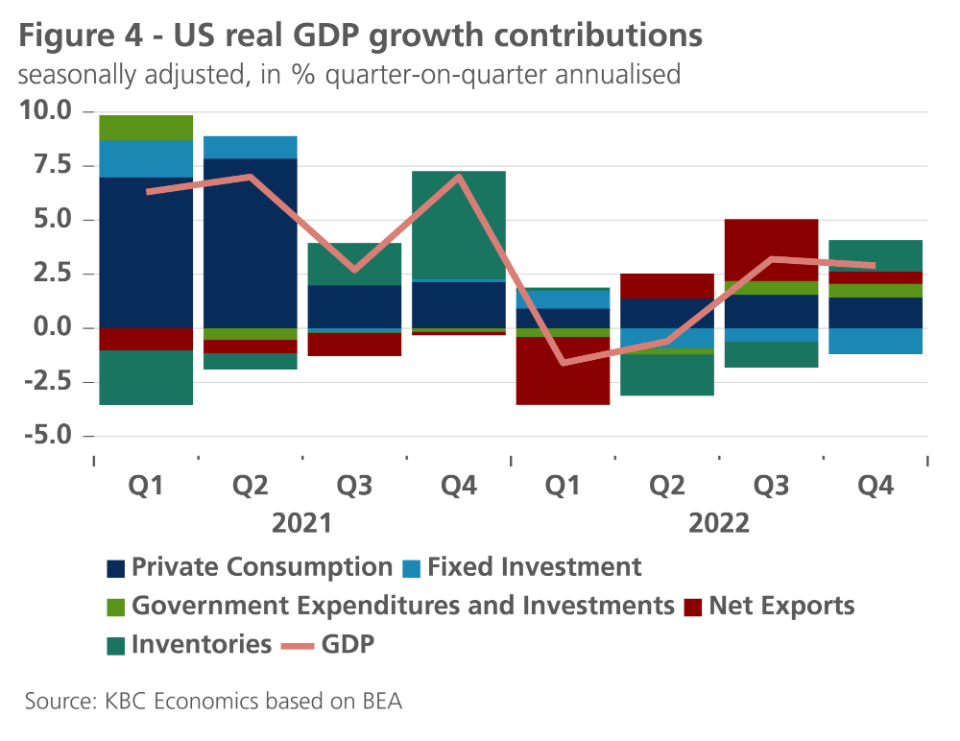
The US grew by 2.9% quarter-on-quarter annualised in Q4 (see figure 4). Though this figure was higher than expected, the underlying details were weak. Higher inventories added 1.46 percentage point to headline growth. As inventory to sales ratios are at their highest level since 2020, this high inventory growth is unlikely to be maintained. Consumer spending contributed a lower than expected 1.42 percentage point to overall GDP growth, primarily because of weaker consumer spending in November and December. In another sign of weakening consumption, net exports contributed 0.56 percentage point to GDP growth as imports declined 4.6% at seasonally adjusted annual rates. Meanwhile, as the housing market continues to face pressure from higher rates, residential investment dragged down GDP growth by 1.42 percentage point.
Though Q4 GDP was mixed, January data provided better news, especially in the labour market. An astonishing 517k nonfarm payrolls were added in January, driving up the participation rate by 0.1 percentage point to 62.4%, while driving down the unemployment rate by 0.1 percentage point to 3.4%. Meanwhile, average weekly hours increased by 0.3h to 34.7h. Job openings surprisingly increased from 10.4 million to 11 million, showing the labour market will likely remain tight in the coming months. Sentiment indicators also mostly improved in January. Most notable was the ISM services, which increased from 49.2 to 55.2 in January, moving from recessionary to expansionary territory.
Due to the continued resilience of the US economy, we upgraded our 2023 Q1 and Q2 forecast by 0.4 and 0.8 percentage point respectively to 1.2% and 0.4% quarter-on-quarter annualised growth. Nonetheless, we do not expect that the US economy can resist the continued monetary tightening pressure forever and expect the US to enter into a very mild technical recession in the second half of the year. We forecast -0.4% quarter-on-quarter annualised growth figures in Q3 and Q4 2023, but risks seem to be to the upside. We thus upgrade our 2023 growth forecast from 0.9% to 1.2%, and downgrade our 2024 forecast by 0.2 percentage point to 0.9%. We expect monetary tightening to also affect the labour market figures in 2024 (pushing the unemployment rate to 4.7% by the end of next year).
Covid (possibly) retreating
China’s relaxation of zero-Covid measures in December triggered a massive wave of Covid-infections in the country. Official data on infections and deaths are unavailable but indirect information confirms that Covid moved through the cities at great speed in December 2022. Many feared that a new, even greater, wave of infections would hit rural areas during the travel rush that traditionally takes place around the Chinese Spring festival. Preliminary data suggest the virus may have already spread to many rural areas in December and that China could thus be achieving herd immunity more rapidly than predicted. This raises hopes of a more limited second wave and therefore also higher real GDP growth.
The quicker than expected start of the recovery is supported by the national and S&P PMI indicators for January. Non-manufacturing confidence improved notably, moving to levels comfortably above the 50 neutral level (see figure 5). The National Bureau of Statistics indicator jumped from 41.6 to 54.4 and the S&P figure went from 48 to 52.9. Manufacturing confidence also improved but less dramatically and to levels still around 50. The Macromill consumer confidence survey also found significant sentiment improvements in January, pointing to the possibility of strong pent-up demand in the current and next quarters.

Given the cautiously optimistic information about the Covid-situation in China and the softer outlook for advanced economies, we upgraded our Chinese real GDP growth forecast for 2023 to 5.0% (previously 4.4%). In the course of 2024, economic activity will normalise as the post-pandemic rebound wears out. We therefore downgraded our annual real GDP growth for 2024 to 4.7% (previously 5.1%). Inspired by the quicker and stronger than expected recovery in economic activity, we also pushed up our 2023 average inflation figure to 2.3%. The main downward risk to our growth forecast is the reinstatement of Covid containment measures, including lockdowns, if the second infection wave materialises.
All historical quotes/prices, statistics and charts are up-to-date, through 13 February 2023, unless otherwise stated. Positions and forecasts provided are those of 13 February 2023.