

Economic Perspectives April 2023
Read the full publication below or click here to open the PDF.
- European gas prices declined moderately in March to 47.9 EUR per MWh driven by softer weather and sky-high gas reserves. Though they remain more than two times higher than their pre-pandemic averages, gas prices are now 85% lower than their August 2022 peak. Oil prices also declined by 5.4% to 79.7 USD per barrel in March due to demand concerns. The recent OPEC+ decision to cut production by 1 million barrels per day will put upward pressure on oil prices in April, however, and TTF-gas price futures also price in potential future price increases.
- Lower energy prices drove down inflation in the euro area from 8.5% in February to 6.9% in March. Yearly energy inflation even turned negative in March. Nonetheless, inflation concerns are far from over. Core inflation increased from 5.6% in February to 5.7% in March as a.o. service inflation is accelerating. As the decline in headline inflation was broadly in line with expectations, we only slightly upgrade our 2023 inflation forecast to 5.8% and maintain our 3% 2024 forecast.
- In the US, inflation declined from 6% in February to 5% in March, driven by lower energy prices and lower food price inflation. Core inflation unfortunately increased from 5.5% to 5.6%, as shelter inflation remains high and goods inflation accelerated. We maintain our 4.4% inflation forecast for 2023 and downgrade our 2024 forecast by 0.1 percentage point to 2.1%
- As financial stability concerns are somewhat diminishing, central banks can again focus on fighting inflation. In the euro area, we expect the ECB to hike its policy rates by 25 bps at each of the next three meetings, resulting in a peak deposit rate of 3.75%. In the US, where the tightening cycle started earlier, inflation is lower and credit conditions are expected to tighten considerably, we only expect one extra rate hike at the next FOMC meeting, resulting in a peak policy rate of 5.125%. We expect either central bank to maintain policy rates at these terminal levels throughout this year.
- In the euro area, March economic indicators showed a mixed picture. On the one hand, the fall in gas prices and the Chinese reopening are supporting the economy. On the other hand, tightening monetary policy is putting an increasing burden on the economy. We maintain our 0.8% and 1.1% growth forecasts for 2023 and 2024, respectively.
- In the US, severe monetary tightening is having only limited impact on growth thus far. The labour market especially remains tight. Nonetheless, continued monetary tightening along with tightening lending standards in the wake of recent financial sector wobbles will eventually drive down growth. We hence downgrade our 2023 forecast by 0.1 percentage points to 1.3% and our 2024 forecast by 0.3 percentage points to 0.3%.
- In China, the economy is recovering rapidly as its economy reopens. The services sector is booming, while low and decreasing inflationary pressure allows policy makers to maintain an accommodating policy mix. Nonetheless, some signs of weakness are emerging in manufacturing and exports, on the back of still lacklustre global demand. We maintain our 5.2% and 4.9% growth forecasts for 2023 and 2024, respectively.
Pessimism about the global economy has increased in the wake of the collapse of three US banks and the take-over of Credit Suisse by UBS. In the short run, these events only had a limited impact on the global economy. The fall in European gas prices, a resilient US economy and a rapid Chinese reopening continued to support economic growth in Q1 2023. Unfortunately, the prospects for the next quarters look bleaker. Though the turbulence in the financial sector has so far had a modest impact on consumer and producer confidence, it will likely induce (mainly smaller US) banks to strengthen their balance sheets and hence tighten lending standards. These tighter lending standards may start weighing on investment and consumption. Unfortunately, this development will coincide with continued monetary tightening and hence add to the global slowdown of growth going forward. Furthermore, risks remain tilted to the downside as further turbulence in the financial sector, even if a tail risk, cannot be excluded.
Gas and oil prices moved downwards but an end to the downward trend is in sight
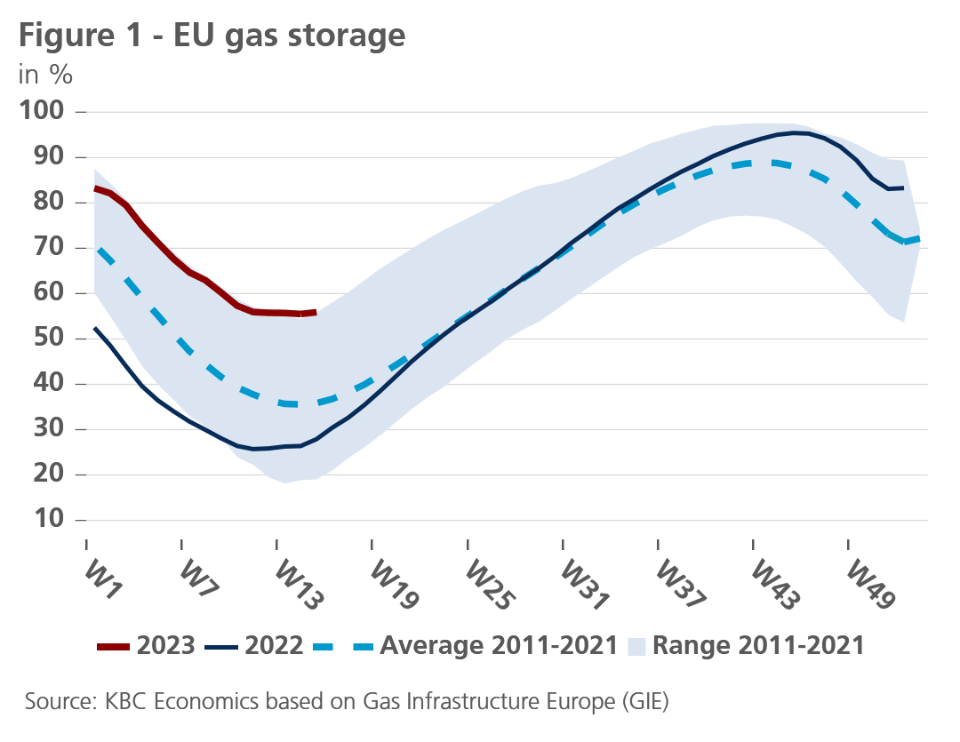
European gas prices declined for the fourth month in a row in March. At 47.9 EUR per MWh, they are now 85% lower than their August 2022 peak, though they remain more than two times higher than their pre-war averages. The downward pressure on gas prices was primarily caused by lower gas demand, as a result of soft winter weather in Europe. Consequently, European gas reserves declined less than usual this winter and now still stand at 55.7% (see figure 1). This exceptionally high fill rate will make the replenishment of European gas reserves much easier. We thus expect European gas reserves to be almost filled by the end of autumn and estimate the risk of energy shortages to be low. Nonetheless, gas futures markets expect prices to increase again in the coming months as the winter of 2024 arrives.
Oil prices also declined in March. Brent oil prices declined by 5.4% to 79.7 USD per barrel before increasing on the back of announced OPEC+ production cuts. The earlier decline was partly driven by the risk-off mode in financial markets following the turbulence in the financial sector. Contrary to expectations, the US is not taking advantage of the lower oil prices to replenish its strategic reserves, due to maintenance works at two of the four sites where the reserves are held. However, from April onwards, oil prices are likely to move much higher as OPEC+ recently announced to cut oil supply by 1 million barrels per day. Oil prices jumped by 6% on the day of the announcement.
Eurozone inflation falls sharply
As expected, eurozone inflation fell sharply in March: to 6.9% from 8.5% in February. The drop was caused almost exclusively by the fall in energy price inflation. This is itself due to a slight further fall in energy prices last March, but mainly has a rather technical cause, dating back to March 2022. Inflation is usually measured as the comparison of current prices with those of a year ago. March 2022 saw a sharp increase in energy (and especially gas and electricity) prices just after the Russian invasion of Ukraine. That boost fell out of the measured price increases in March 2023. This so-called base effect, combined with recent energy price declines, contributed to the annual energy price inflation falling from 13.7% in February to -0.9% in March.
However, the price pressures for most other components of the consumer price index remain stubbornly high, and continue to rise slightly in most cases. This is especially true for food, whose rate of price increases increased further by 0.4 percentage points to 15.4% in March. Core inflation, which excludes food and energy prices, also increased slightly from 5.6% in February to 5.7% in March, mainly due to the increase in services inflation from 4.8% to 5.0%.
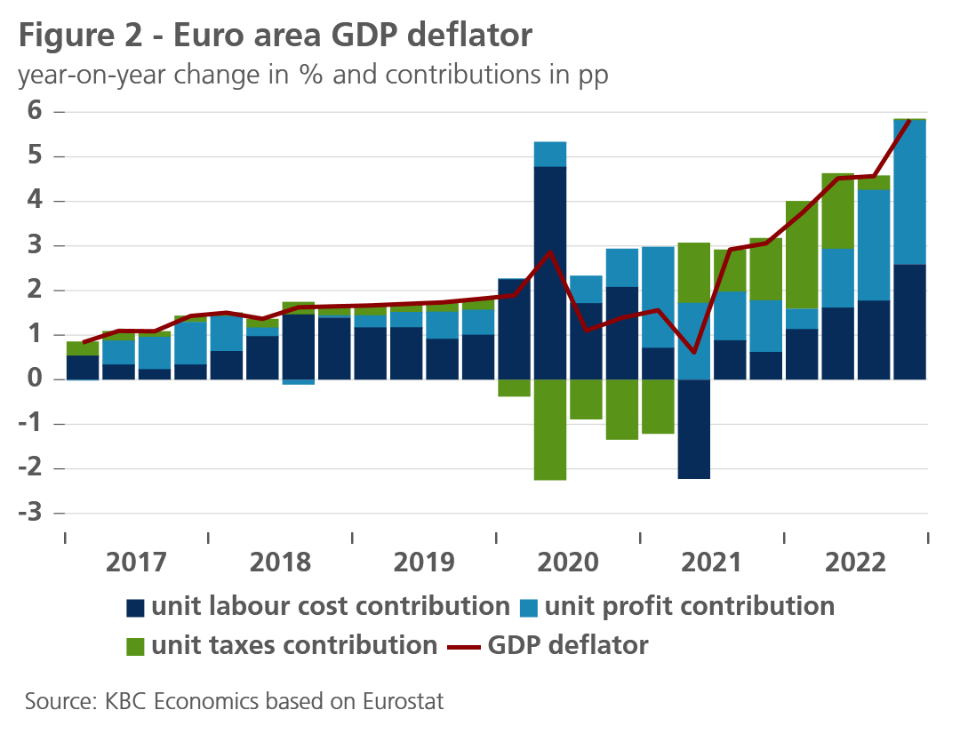
Consequently, the sharp inflation cooldown misrepresents somewhat underlying inflation pressure in the euro area. Leading indicators suggest that food price inflation could start to cool in the coming months. But core inflation remains stubbornly high. An analysis of the GDP deflator, a broader measure of (domestic) price pressures in the economy, shows that, next to rising wage cost pressures, widening profit margins and mark-ups contribute to persistent core inflation (see figure 2). The latter could spell both good and bad news for further inflationary trends. Wage-cost pressures are expected to continue to rise, as wages are expected to (partially) catch up to the sharp inflation rebound of the past year (In Belgium, this has already happened due to automatic wage indexation). If this additional wage pressure is (fully) passed-through to consumer prices (by maintaining or even increasing profit margins), the inflation outlook may worsen considerably with core inflation higher for longer. But in our baseline scenario, we assume that due to lacklustre demand and firms’ decreasing pricing power, profit margins will at least partially absorb higher labour costs. The more favourable trends of other production costs, including energy and imported goods, are expected to dampen inflationary pressures. All in all, we expect a (very) gradual cooling of core inflation. Obviously, this expectation remains surrounded by considerable uncertainty and risks are tilted to the upside (see also: KBC Economic Research Report of 24 March 2023). For the eurozone, we expect an average inflation rate of 5.8% in 2023 and still 3.0% in 2024.
Lower energy prices drive down US headline inflation, as core inflation increases again
US inflation declined from 6% in February to 5% in March. The decline was driven in large part by lower energy prices, which declined by 3.5% month-on-month. Energy prices declined by 6.4% year-on-year. Food prices stagnated last month, as lower global food prices and declining food-related US producer prices are putting downward pressure on food inflation.
Unfortunately, core inflation remains elevated and increased by 0.4% month-on-month. It now stands at 5.6%, 0.1 percentage point higher than last month. Higher shelter inflation remains the main culprit as shelter prices increased by 0.6% month-on-month to 8.2% year-on-year. Unfortunately, the Zillow Observed Rent Index, a leading shelter indicator, increased by 0.4% in March, indicating continued elevated shelter inflation in the coming months.
Driven by a lower dollar, goods prices increased by 0.2% month-on-month to 1.6% year-on-year, 0.6 percentage points higher than last month. The increase happened in spite of a decline in used car and truck prices of 0.9%. As leading indicators show, this subcomponent will likely drive up goods inflation in later months (see figure 3).

A positive surprise was service inflation (excluding shelter and energy services), which increased by 0.1% last month. However, this is mostly a result of declining medical care services prices which have been declining since October because of a Covid-related methodological change. Excluding medical care services, this component increased by 0.3% month-on-month, in line with wage inflation. Average hourly earnings namely also increased by 0.3% month-on-month and by 4.2% year-on-year, a slower pace than in prior months, but still too high to be comfortable.
All in all, we maintain our 4.4% inflation forecast for 2023. We do expect inflation to come down in 2024 as a result of monetary tightening and tighter lending standards and hence downgrade our 2024 forecast by 0.1 percentage point to 2.1%.
Central banks refocus on inflation, as acute financial stability concerns diminish
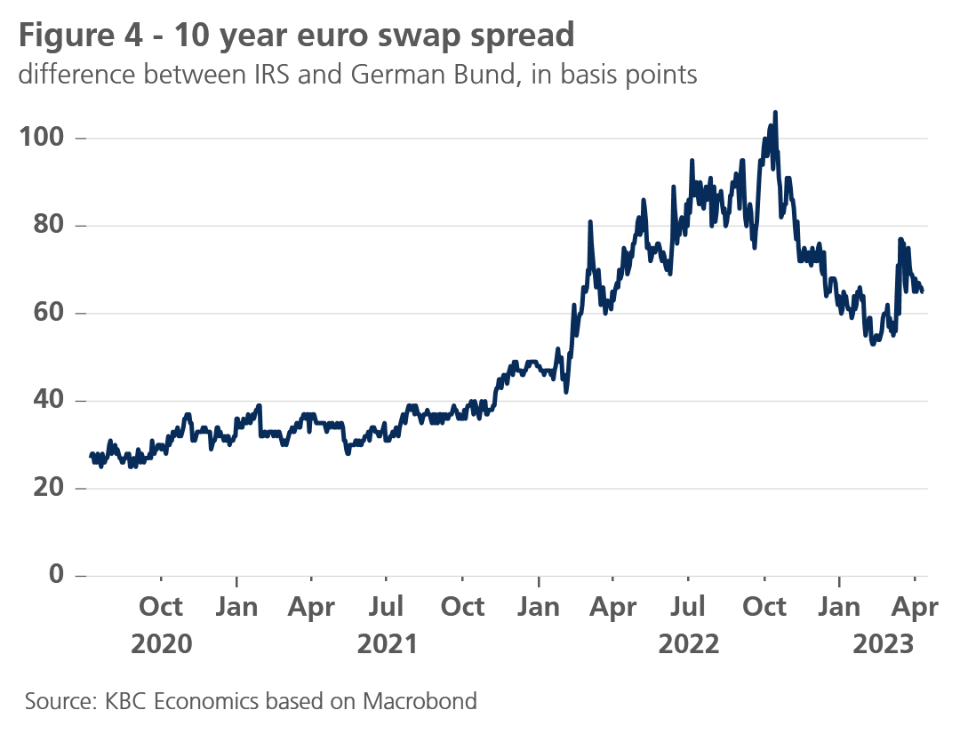
Strong interventions by fiscal authorities, financial supervisors and central banks worldwide, but in particular in the US and Switzerland, broadening the scope of deposit guarantees and providing the required liquidity, managed to contain the potential spillovers of the stress in specific US and European banks. As such, the recent turmoil in the banking sector seems under control and this observation serves as working assumptions in our base scenario. This is also in line with market expectations: the strong increase of risk premia for exposure on the financial sector (see figure 4) is quickly reversing in the aftermath of the crisis.
Against the backdrop of decreasing financial fragility concerns, both the Fed and the ECB can focus again on their primary policy objective of price stability. Given the persistently high US core inflation, the Fed is likely to raise the policy rate one (final) time in its May meeting, reaching the terminal rate of 5.125%. Risk remain tilted to the upside.
We expect the Fed to maintain policy rates at this peak rate throughout 2023. However, the first rate cuts may come earlier than previously anticipated. The risk of a deeper US technical recession in the second half of 2023 (see further) and a further tightening of credit conditions lead us to expect a first Fed rate cut (25 bps) already in Q1 2024. This will mark the beginning of an easing cycle towards 3.375% at the end of 2024 and to 2.875% at the end of 2025. This rate path for 2024-2025 is lower than communicated in the latest Fed ’dot plots’.
While adjusting the path of US long-term yields downward, we still expect an upward correction from current levels to a peak rate of 3.70%. The Fed is likely to continue its ‘Quantitative Tightening’ (QT) – at a pace of 95 billion USD per month – which functions as a technical operation in the background of the monetary policy rate cycle.
For the ECB, we maintain our earlier view of three more consecutive rate hikes (25 basis points each), leading to a terminal rate of 3.75% at the beginning of July 2023. Since the ECB started its tightening cycle later than the Fed, and since real (longer-term) interest rates remain lower than in the US, we expect the ECB to also start its rate cutting cycle later. This will not start before the second half of 2024. At the end of 2025, we expect the ECB’s deposit rate to be broadly at its neutral level of about 2.25%, which is marginally positive.
Similar to our scenario for US bond yields, we expect an upward correction in Q2 2023 for German long-term government bond yields to a peak of 2.70%. As is the case for the US, we have revised downward this peak compared to last month.
In terms of its QT, the ECB is currently reducing its balance sheet at the pace of 15 bn EUR per month (on average) by not fully reinvesting maturing assets of its APP portfolio. In line with the early repayments of TLTROs at the end of 2022, the purpose of the ECB’s QT is to withdraw some of the ample amount of excess liquidity from the financial system. If markets continue to react well to the current, still very moderate, pace of QT, the average monthly pace is likely to increase materially from Q3 2023 onwards.
Even during the recent temporary turmoil on financial markets due to concerns about the health of the global banking sector, country risk premia, as implied by the spread of euro area sovereigns versus the Bund, remained broadly stable. On the one hand, this may have reflected the markets’ conviction that this was not a systemic financial crisis and that there was no reason to re-price the bank-sovereign doom loop. On the other hand, this was probably also the result of the still ample amounts of excess liquidity in the euro area, in combination with the availability of the ECB’s Transmission Protection Instrument (TPI). While the excess liquidity still creates a strong ‘search for yield’ incentive for investors keeping a lid on sovereign spreads, the apparent credibility of the TPI reassures markets that the ECB will not tolerate ‘unjustified’ increases of risk premia between euro area sovereigns. In sum, we expect the ongoing upward spread normalisation to be very gradual and moderate during the forecast horizon.
Faltering economic confidence in eurozone
In the eurozone, the faltering performance of confidence indicators paints a somewhat mixed picture of economic dynamism – or lack thereof. The continued sharp improvement in the service sector PMIs stood out the most. The indicator rebounded from 52.7 in February to 55.0 in March, well above the neutral level of 50, indicating a sharp improvement in the climate in the service sectors. However, the stark improvement in PMI confidence indicators for the service sector should be nuanced somewhat. The most recent European Commission’s (EC) broader confidence surveys for the service sectors indicate a slight weakening of confidence. For the manufacturing sector by contrast, both the PMIs as well as the European Commission’s confidence surveys indicate a (mild) weakening of confidence.
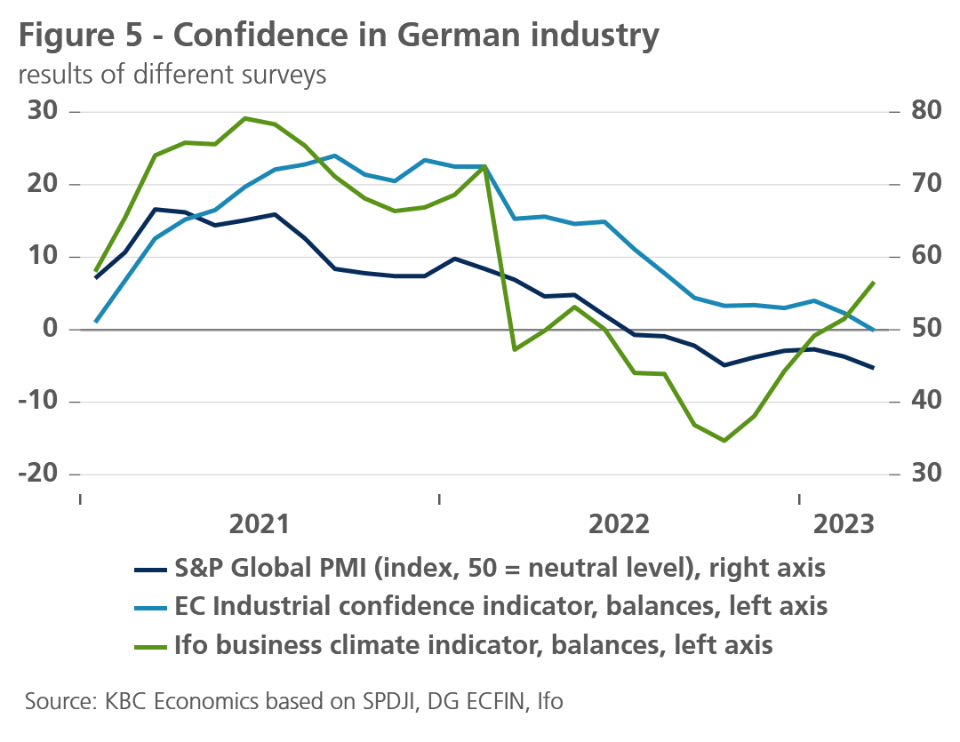
At first glance, the latter is not very reassuring, especially given that the recovery of confidence in industry over recent months has not been very strong. An analysis of confidence indicators at the country-level suggest that confidence weakens in particular in the German industry. In the other major euro area countries, we observe a (slight) improvement in most confidence indicators in the manufacturing sector. That, in turn, is more reassuring. Fortunately, national indicators on German manufacturing also paint a more encouraging picture than the PMI and the EC indicator. Also, according to the Ifo Institute’s surveys, there is a further recovery in confidence (see figure 5).
All this confirms our current assessment that the euro area as a whole, and probably Germany as well, will avoid a (technical) recession of two consecutive quarters of negative economic growth during last winter. However, growth will remain particularly meagre. Indeed, consumers also remain very cautious. The windfall gains for purchasing power from lower energy prices is, for now, neutralised by sharply rising food prices. The ECB’s tighter monetary policy will also increasingly start to impact economic consumption and investment choices. Consequently, the recovery in consumer confidence stopped in March, leaving it stranded at below-neutral levels for now. In the services and retail sectors, this translates into prospects of lacklustre demand development in the coming months.
All in all, the new information confirms our scenario of very weak but positive economic growth in the euro area. We have therefore left our forecast for real GDP growth unchanged at 0.8% for 2023 and 1.1% for 2024. For France, the growth forecast for 2023 was lowered by 0.1 percentage point to 0.7% due to the many strike days, while the expected growth rate for the Dutch economy was increased by 0.1 percentage point to 1.5% due to a revision of historical figures.
Tighter financial conditions will weigh on US growth
The continued monetary tightening does not seem to heavily impact US growth for now. US consumer spending remains healthy, as the labour market remains in strong shape. The labour market added a solid 236k non-farm payrolls in March. Unemployment fell by 0.1 percentage point to 3.5%, while the participation rate increased by 0.1 percentage point to 62.6%. There are some signs of weakness in the labour market, however. Temporary help services, a leading indicator of future employment, declined in March. Meanwhile job openings dropped to 9.9 million in February, a 12% decline vs the December peak. As a result, the key labour market ratio for the Fed – the number of job openings divided by the number of unemployed – fell to 1.67, the lowest level since November.
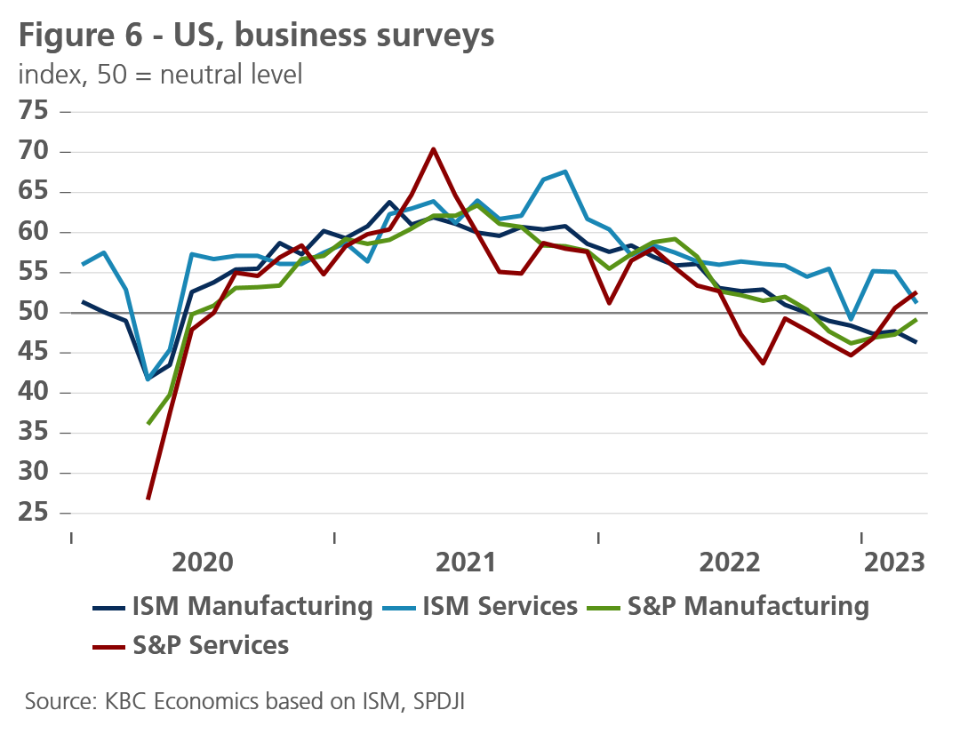
Furthermore, the recent troubles in the US financial sector seem to have impacted confidence indicators. University of Michigan consumer sentiment declined by 5 points to 62, but remains 12 points higher than June 2022 lows. The Conference Board consumer confidence index, however, increased by 0.8 points. Business confidence indicators also edged downwards overall (see figure 6). Recall that the business sentiment in the most important sector of the US economy – the services ISM – showed a broad-based setback in March, as the details of the report were quite disappointing (quite heavy declines of the new-orders and employment sub-indices).
All in all, on a quarter-on-quarter annualized basis, we maintain our Q1 growth forecast of 2%, while we downgrade our Q2 growth forecast from 0.8% to 0.4%.
The growth outlook in later quarters is, however, less rosy. Not only monetary tightening will drive down growth, so will tighter lending standards. After the SVB collapse, smaller US commercial banks suffered 232 bn USD of deposit outflows in only two weeks’ time (4.1% of their total deposits), mostly to larger banks and money market funds. To shore up their balance sheets, these smaller banks will likely tighten credit conditions, negatively impacting US growth. We hence lowered our growth forecast in H2 2023 and H1 2024. All in all, we downgraded our 2023 and 2024 forecasts by 0.1 and 0.3 percentage point respectively to 1.3% and 0.3%.
End of zero-Covid boosts service sector in China
The Chinese government’s decision, late last year, to abandon its zero-Covid policy set the stage for a strong economic rebound in 2023. With Q1 now behind us, we can conclude that the economic rebound is in fact underway but that it is currently going at a modest pace. This was confirmed by the first hard data for January-February. Compared to the same period last year, retail trade went up by 3.5% and industrial production by 2.4%, increases that are from a longer-term perspective still (surprisingly) moderate. In addition to this, growth in the durable goods components of the retail trade remained negative, with car sales down 9.4% and household appliances 1.9% lower than the same period last year. Fixed asset investment also remained relatively weak, with year-on-year investment growth in real estate improving, but still in deep negative territory (-5.7%). This suggests that for now investors continue to shy the real estate sector, despite some recent cautious improvements in monthly price dynamics in commercialised residential real estate in February.
Looking ahead, we expect further growth acceleration in the services sector on the back of strong PMI data in Q1. The PMI data for the services sector have been increasing since the beginning of 2023 and are now well into expansionary territory. In the manufacturing sector, the PMI data were more mixed in Q1 and display high volatility. Some of the improvements that were seen in February reversed again in March and the overall PMI levels are lower than in the services sector. Looking at the subcomponents, we see a particular weakness in export orders that is caused by the weak external environment. Going forward, based on the producer confidence indicators, we expect more growth support from the services sector than from manufacturing.
For now, we are keeping our growth and inflation outlook unchanged but downward corrections are possible in the future if the expected acceleration in (particularly domestic) economic activity does not (fully) materialise. We also still expect the People’s Bank of China will cut its medium-term lending facility rate later this year, following other supporting measures taken at the beginning of this year (including a reduction of the reserve requirement ratio for most banks in March and continued liquidity injections in the banking system through the medium-term lending facility).
All historical quotes/prices, statistics and charts are up-to-date, through April 11, 2023, unless otherwise noted. Positions and forecasts provided are those as of April 11, 2023.