

Economic growth ten years after the financial crisis: a half-full glass

On 15 September 2008, the American bank Lehman Brothers went bankrupt. What at first glance appeared to be softly simmering problems in the US exploded into the worst global financial crisis since the 1930s. Ten years later, the economic engine is running at full speed in the US. In the second quarter of 2018, real GDP growth picked up to 4% (annualized). Forecasts for the whole of 2018 have been adjusted upwards. For the euro area, 2018 looks set to be a year of unfulfilled expectations. While growth forecasts have been continuously upgraded throughout 2017, there have been downward adjustments over the course of 2018. After the turn of the year, the growth engine in the euro area began to sputter.
Nevertheless, a look back at economic growth in the ten years before and after the financial crisis shows that economic growth in the eurozone at present remains fairly strong. So despite the recent downward adjustments, growth in the eurozone is not necessarily a disappointment. A few years ago, many feared that the eurozone would have a long period of low economic growth ahead of it. Fortunately, this pessimistic view of growth, often referred to as 'secular stagnation', has not materialised. But this does not change the fact that challenges to strengthening growth potential still remain; in fact, they may have been reinforced by the financial crisis. In the past ten years, average real GDP growth has been significantly lower than in the previous decade for both the US and the eurozone.
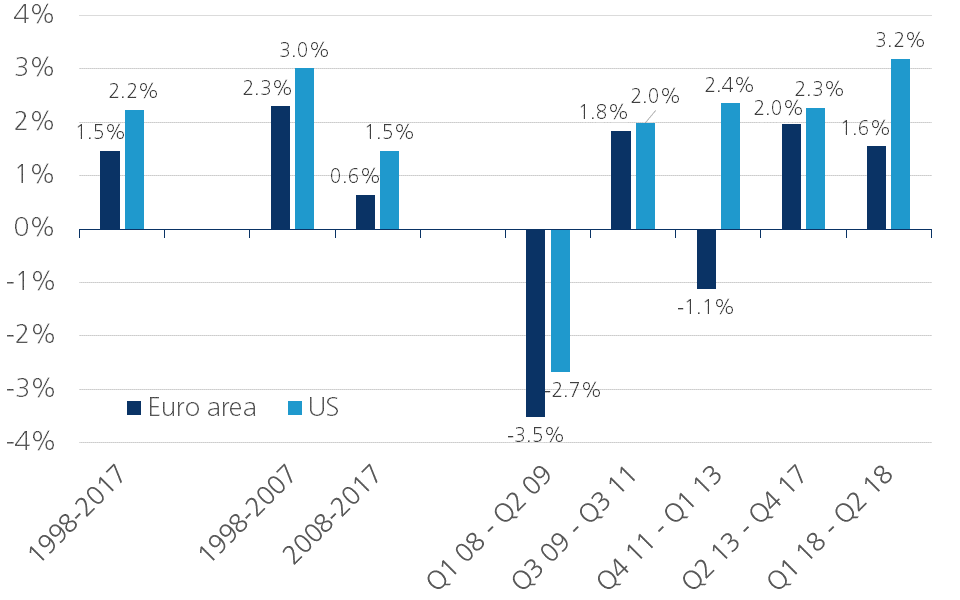
Over the period 1998-2017, annual real GDP growth averaged 1.5% in the euro area and 2.2% in the US (Figure A). A breakdown of these growth rates over the ten-year periods before and after the financial crisis shows that real growth in both economies slowed sharply after the financial crisis. In the US, annual average growth halved from 3% in 1998-2007 to 1.5% in the following ten years. In the euro area, the decline was even more pronounced: from 2.3% to only 0.6%.
Figure A - Real GDP growth (annual average percentage change)
This more pronounced slowdown in growth is the result of a stronger economic downturn in the eurozone during the Lehman crisis and especially of the second recession in the eurozone due to the European debt crisis in 2011 (Figure B). Moreover, in the years following the recessions, the European economies recovered less strongly than the American economies, but the difference was perhaps not as great as might have been envisaged. In the US, real GDP recovered fairly quickly to pre-Lehman levels (Figure C). But after that recovery, the growth of the US economy remained fairly well below its pre-crisis growth level for some time. This may be due in part to the eurozone’s struggles with a second recession. All in all, the recovery of the US economy was rather hesitant. This lent some credence to the arguments of growth pessimists, with many touting theories of 'secular stagnation', a concept that dates back to the period of the economic depression of the 1930s. For the eurozone, a 'Japanese scenario' of decades-long zero growth was expected.
Figure B - Real GDP growth (annual change in %, dotted line = average period 1998-2007)
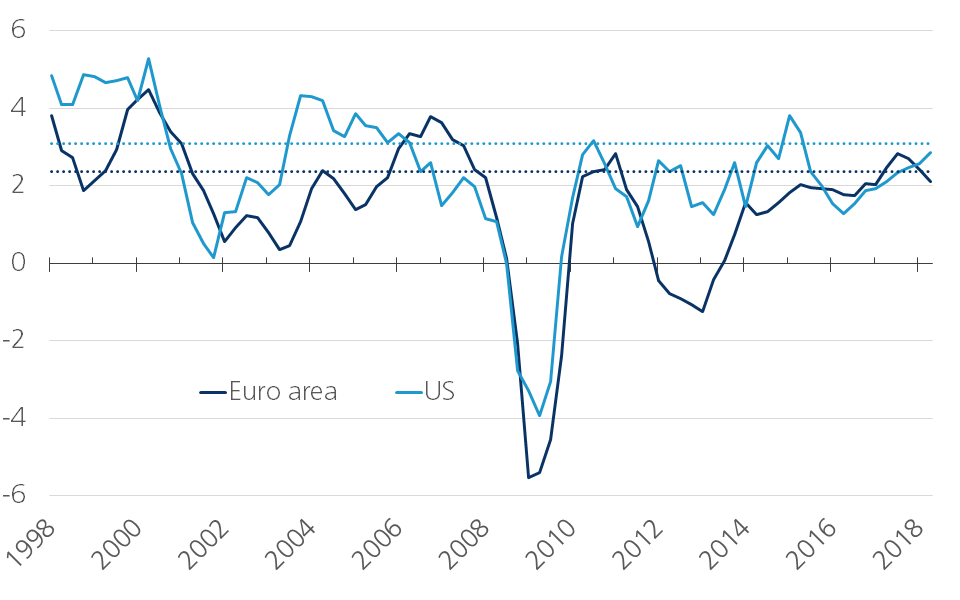
Fortunately, the growth pessimists were wrong. From 2014, the eurozone economy began to improve, with growth in 2017 peaking above the average growth level of 1998-2007 (Figure B). For a short time, the euro zone even became one of the global leaders in economic growth. After a few strong growth quarters in 2014-2015, the annual growth rate of US real GDP fell short of that of GDP growth in the euro area. Boosted by a fiscal stimulus, the growth of the US economy accelerated again in the first half of 2018 to above its long-term average. Capacity constraints in some economies and uncertainty, including Brexit and the threat of a trade war, have slowed growth in the euro area from over 2.5% in 2017 to around 2% (year-on-year) in the second quarter of 2018, but this is still well above the average of the last twenty years.
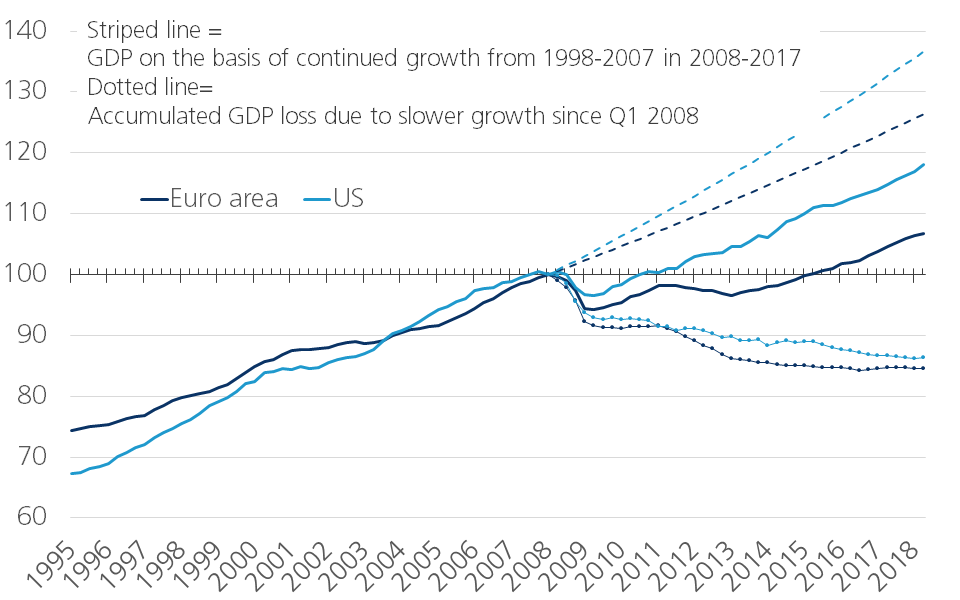
The slower GDP growth in the ten-year period following the financial crisis means that today's real GDP is significantly below the level that would have been achieved if the average pre-crisis real GDP growth had been repeated (Figure C). For the US, the loss of wealth measured by real GDP in mid-2018 is slightly less than 15%, for the euro area slightly more.
Figure C - Real GDP (Q1 2008 = 100)
A recent analysis by the IMF (World Economic Outlook, October 2018) concludes that permanent welfare losses have been a global phenomenon since the financial crisis. Worldwide, 24 economies were hit by a banking crisis in 2007-2008 and in 20 of them GDP is still below the level that would have been achieved if the economy had continued to grow at the pace it was at before the financial crisis. This is to be expected, as it has also occurred in previous financial crises. Additionally, evidence shows that recovery periods after recessions associated with a financial crisis were often more difficult. They caused a structural slowdown in the rate of growth, as a result of which the level of prosperity was permanently lower. The exceptionally severe impact of the recent financial crisis is reflected in the fact that even in 60 percent of the economies1 that have not experienced a banking crisis themselves, there has been a structural loss of welfare. This is also linked to the strong international interdependence of the world economy through trade relations and financial flows.
There are several reasons why a financial crisis makes recovery from recession particularly difficult. In a financial crisis, banks are usually in facing financial difficulty themselves, making it harder for them to provide credit. This affects lending to productive, creditworthy projects, especially in economies where alternatives to financing via the banking system are scarce. A poorly functioning banking system also hinders the effectiveness of monetary policy, as policy changes from the central bank must to a large extent reach the real economy via the banking system. Again, this channel is all the more important as the central bank has few alternative channels for the transmission of its policy, for example if capital markets are underdeveloped. The persistent problems in the eurozone banking system - first as a result of the Lehman crisis in the US and then as a result of the debt problems in the eurozone itself - are undoubtedly an important explanation for the difficult economic recovery in the eurozone following the recent financial crisis.
The effects of a financial crisis usually spread outside of the financial sector and are often accompanied by additional obstacles to recovery from recession. Financial crises often originate in real estate crises, often preceded by excessive household or construction promoter debt accumulation. In the euro area, Ireland and Spain are typical examples. Other economic sectors may also be over-indebted, for example, if unusually cheap credit allows unproductive investment or excessive consumption. This played an important role in countries such as Greece and Portugal. Over-indebtedness of companies can also be the result of insufficient flexibility in the economy. As a result, there is not enough 'creative destruction', in which new, productive companies take the place of unproductive ones. Credit thus accumulates in unproductive businesses, which are kept alive sometimes by lax lending criteria, and sometimes because of government intervention. While the situation has improved considerably in many crisis countries, it still remains the case that as a result of all kinds of economic rigidities the historical accumulation of debt is still a heavy millstone around the neck of some countries, such as Italy.
One important reason why financial crises resulting from excessive debt accumulation make recovery from recession more difficult is that those who have to pay off too much debt postpone consumption or investment spending. However, we should not conflate the loss of welfare that might have occurred if there were no crisis with that lost due to the crisis, as part of the growth before the crisis was achieved with excessive debt accumulation what would not be sustainable in the longer term. In other words, growth before the crisis was too high. Part of the welfare was fake wealth. Concurrently, slower growth after a financial crisis is not necessarily caused by the financial crisis. There were factors at work that have nothing to do with the crisis, such as changes in trends in technological progress or demography.
The exact impact of each individual factor is difficult to determine with any great accuracy. Figure D compares, for the euro area and the US, the contribution of four main drivers of economic growth in the ten-year period before and after the financial crisis: 1) the growth of the working population2, 2) the employment rate, which indicates what proportion of the working-age population actually works; 3) the average working time per worker; and 4) labour productivity, which itself is strongly determined by total factor productivity (see below).
Figure D - Composition of economic growth (contribution to growth in percentage points)
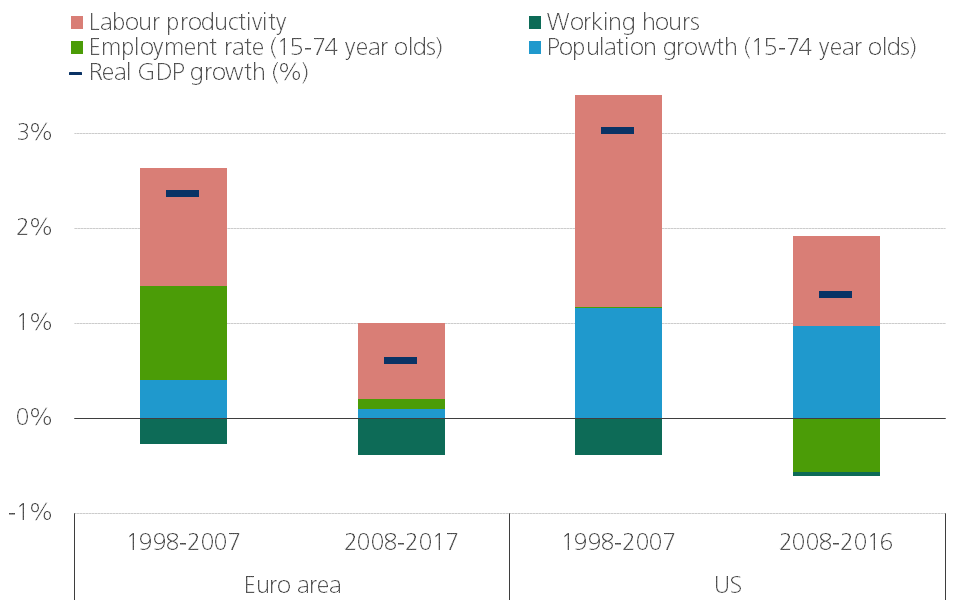
A significant part of the higher economic growth in the US can be explained by stronger population growth. The euro area has tried to compensate for its slower population growth by employing more people. The increase in the employment rate made a significant contribution to growth, especially in the pre-crisis period, although it was slightly weakened by the fact that an average working person started working slightly fewer hours. In the post-crisis period, the decrease in average working hours even completely neutralised the increase in the participation effect. Indeed, many of the newly created jobs were part-time jobs, which reduced the average working time per worker. This trend was also true in the US before the crisis, but seems to have come to a standstill after the crisis. During this period, the negative impact of the American rate of engagement with the labour market is particularly striking. Many Americans have left the labour market or have not found their way to it in the past ten years. A mixture of structural factors (for example the further development of social protection under the governments of President Obama) and cyclical factors (people who are unable to find a job due to the recession and are discouraged leaving the labour market) plays a role here. In passing, it can also be noted that these factors have also made finding the right setting for monetary policy more difficult. They complicate the precise assessment of the tightness on the labour market and inflation, which are the key determinants for US monetary policy. On the other hand, the data seem to suggest that a significant part of the slower growth since the financial crisis in the US is due to the fact that demographic growth is being converted into new jobs at a slower rate.
Finally, lower labour productivity growth is an important explanation for the slower economic growth since the financial crisis. This is true in both the euro area and the US. Labour productivity measures how much value added is created per worker. This is determined by many factors, some, but by no means all, of which may have been affected by the financial crisis.
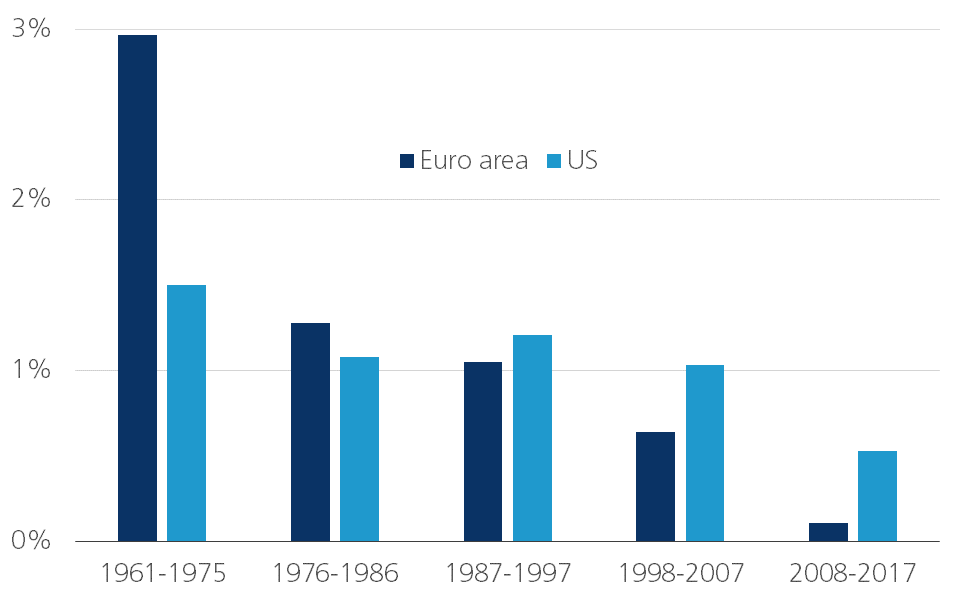
An important driver of productivity is technological progress and its efficient use in production processes. Economists estimate this on the basis of total factor productivity. Figure E illustrates that this has declined trend-wise in recent decades. The reconstruction after the Second World War and catching up with the technologically much more advanced US economy gave the European economies in the “golden sixties” of the last century an annual productivity boost of almost 3%. After the oil shocks of the 1970s, productivity growth slowed considerably. This also happened in the US, as it experienced difficult economic conditions and a technological slowdown. However, the integration of computer technology into the economy allowed the US to maintain productivity growth in the following decades. There was even a temporary resurgence of growth. In Europe, however, the slowdown in productivity growth continued unabated, despite the liberalisation of product, service and financial markets and further steps in economic integration, which can be expected to improve economic efficiency.
Figure E - Total factor productivity (average annual change in percent)
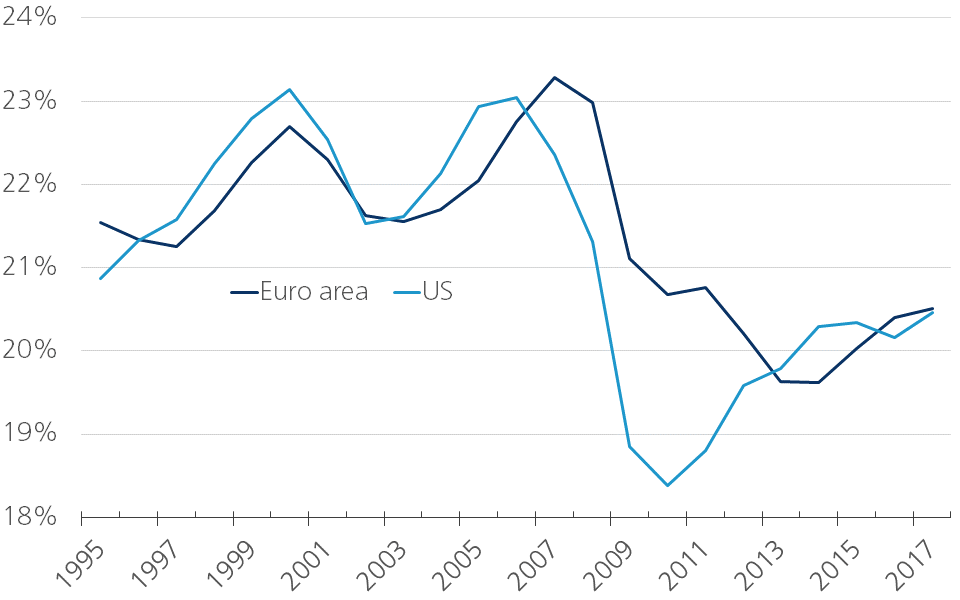
Since the financial crisis, total factor productivity growth has continued to decelerate, both in the euro area and in the US. In part, this is probably the continuation of the downward trend of previous decades. But the accentuation of the downturn is probably also due to the financial crisis. As mentioned above, it makes recovery from the recession more difficult. Because the economic recovery is slow, perverse effects arise, which make the recovery even more difficult. The longer people remain unemployed or young people do not find a job, the more talent is lost. This undermines the growth of labour productivity. The lack of a sufficiently strong recovery in demand or the need to reduce debts from the past causes companies to postpone investments. As a result, the production system becomes obsolete and new, more efficient technologies are only introduced after a delay. In this way, too, productivity growth is hampered. Figure F illustrates that both in the US and the euro area, the share of investment in GDP fell sharply during the crisis years. In the US, the recovery has been relatively rapid and has largely stalled since 2015. In the euro area, it has taken until then for a recovery to start.
However, both economies still have investment ratios well below pre-financial crisis levels. This partly reflects over-investment in the pre-crisis period, particularly in the housing market. The fall in the investment ratio may also be related to the trend decline in the price of investment compared to the price of other goods and services. This is a trend that started long before the financial crisis. But the fall in the investment ratio may also have been accentuated by the weaker growth prospects and the deterioration in corporate profitability in the wake of the financial crisis (IMF, 2014).
Figure F - Share of investment in GDP (in %)
To this end, we can say that slower economic growth since the financial crisis is undeniable, both in the US and in the euro area. However, it is more difficult to determine what part of the growth slowdown is attributable to the financial crisis. Fortunately, the heavy growth pessimism of a few years ago has not materialised. In the recent past, the glass of economic growth has started to fill up again. But the glass is at most half full. Strengthening the growth potential remains more than desirable.
1/ In total, the IMF studied 180 countries.
2/ In Europe, it is generally considered to be the population between 15 and 64 or 20 and 64 years old. In the US, there is usually no upper limit. For the sake of comparability, we consider the population between the ages of 15 and 74.