Does the flattening of the US yield curve herald a recession ?
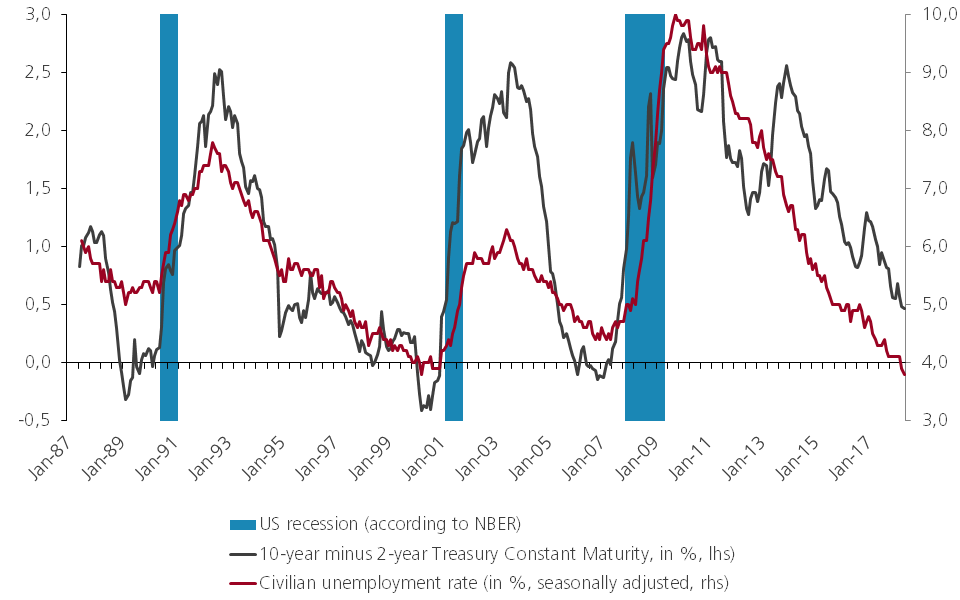
The current US economic expansion has thus far lasted 107 months. It’s the second longest cycle on record since 1858. The 10-year cycle between the mild recessions in the early 90s and early 2000s, propelled by the dotcom bubble, holds the current record. Our in-house forecasts suggest that a new record is in the making. President Trump’s late cycle fiscal boost (tax reform, planned infrastructure spending) raises the odds. Nevertheless, the longer the expansion lasts, the closer we come to the end. The worrying escalation in the trade conflict risks weighing on consumption and investments. The shape of the US yield curve in the past proved to be a good indicator of a recession. An inverse shape of the curve, with short-term yields (2y) exceeding the level of long-term yields (10y), correctly predicted the previous seven US recessions. The last false signal dates back to 1967.
Early 2017 the US 10y2y spread differential still exceeded 130 basis points. Now, in mid-June, it has already narrowed to 35 basis points, the flattest level since 2007. Hence, the question is whether we are on the eve of a recession in the US? Not necessarily.
In looking for the answer, we use a model-based approach to derive the probability of a near-term recession. Specifically, we estimated the probability of a recession (implied by the slope of the yield curve) by a simple logit model, where the dependent variable only takes two values: recession = 1 or no recession = 0. The only explanatory variable is, in our case, the lagged slope of the US yield curve. The nice thing about the logit model is that it keeps the recession probability (the dependent variable) in the range of 0-1, while the explanatory variable is unbounded (the slope of the curve, expressed in basis points, could go from -∞ to +∞).
As concerns the data, we used the NBER recession dates as the dependent variable, while we took the spread between 10y and 2y UST treasury yields as the only explanatory variable. We also decided to limit the monthly time-series sample to the period of 1987 to the present, as we think there was a structural break after Alan Greenspan replaced Paul Volker as Fed Chairman and the US monetary policy framework became much closer to the current inflation-targeting regime.
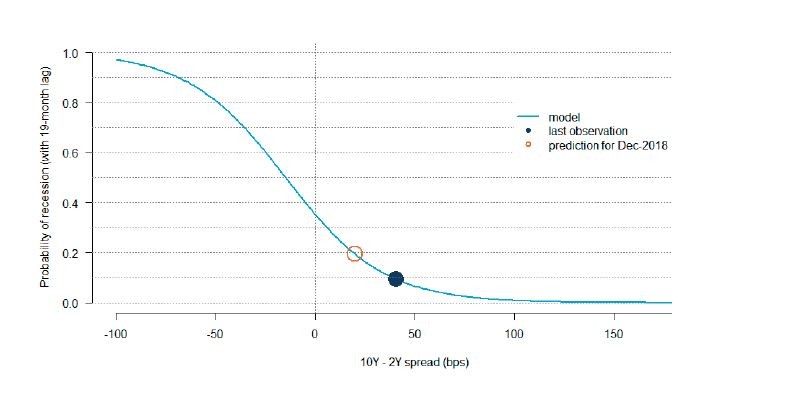
Regarding the results, we found that the regression model with a 19-month lag has the best explanatory power has. In other words, the model implies that the current 10y2y UST spread standing at 35 basis points implies an 11.6% probability of a US recession in a 19-month horizon.
A sharp rise of the front end of the US yield curve is primarily to blame for the tight 10y2y UST curve spread. The US 2-year yield increased from 1.25% in early September to 2.55% currently. Investors underestimated the pace of the Fed’s tightening cycle as the US central bank gradually hits its dual mandate of maximum employment and price stability. The Fed is dedicated to raising rates towards neutral levels. FOMC chair Powell suggested that the US central bank is four hikes away from achieving this (2.75%-3% by mid-2019).
Figure 1 - The US curve and the threat of a recession (1987-2018)

Source: KBC Group Economic Research based on Thomson Financial Datastream
The increase of the US 10-year yield occurred at an obviously slower pace, from 2% in early September to 2.85% currently, on revived reflation bets. Multiple tests to break above key resistance in the 3%-3.07% area failed though. A move higher would end the 30-year bull run of the US bond market. The Fed consistently lowered its neutral rate forecast from 4.25% in early 2012 to 2.875% currently. We consider this partly as admitting that the US long-term trend productivity growth is lower than it was ahead of the great financial crisis. Anyway, it probably helps cap long-term US yields.
Looking forward, we expect the pace of the flattening of the US yield curve to slow going into the year-end, expecting a more simultaneous curve move. Our end-of-year forecast for the 2-year and 10-year yields are 3% and 3.2%, respectively. The front end of the curve will probably adapt to more rate hikes. The scenario of 25 basis points of Fed tightening in both September and December isn’t completely discounted yet.
We expect higher long-term rates for several reasons. First, the FOMC’s median forecast about the neutral rate is on the brink of changing from 2.875% to 3%. The current growth and inflation outlook remains bullish despite rising (trade) risks. Reflationary spirits support higher US rates if trade risks don’t materialise. Second, US financing needs are spiraling out of control with +5% of GDP budget deficits expected in the coming years. The increase in supply of debt occurs in lockstep with the Fed’s balance sheet reduction. The Fed gradually steps up the pace of stopping reinvestments of maturing bonds from its QE portfolio to $50bn/month from October onwards. Another significant buyer of US Treasuries, China, has threatened to slow down/halt purchases for its huge FX portfolio as a potential retaliation measure in the trade war. If US long-term rates only increase because of the second reason (higher US credit risk premium), it might underestimate the recession risk calculated via the shape of the US yield curve.
So, how does our longer-term 10y2y spreads view fit with the model-based recession estimate? Actually, a 20 basis points spread of the UST 10y2y by the end of the year implies a 19% probability of a US recession in a 19-month horizon. Our long-run forecast suggests that the UST 2y10y yield spread could approach the zero bound by mid-2019. Still, even at this point – with a flat yield curve - the model-based probability of a US recession (again on a 19-month horizon) stands ‘only’ at 34%.
Figure 2 - Probability of a US recession (Logit model, fitted values)

Source: KBC Group Economic Research
Nevertheless, we should post one warning at the end. Our simple model also indicates a significant non-linear increase in recession probabilities once UST 10y2y spreads enter negative territory. Markets and policy-makers should be on alert once the yield curve really inverts. According to our simple logit model, a just slightly negative UST 10y2y spread at 16 basis points already implies a 51% probability of recession one year and a half later.


