
Voting Leave: what were the underlying factors behind the Brexit vote?
Abstract
The outcome of the 2016 UK EU membership referendum was rather shocking as many polls preceding the referendum pointed towards a majority for the continued participation of the UK in the EU. In this research report we try to understand the underlying reasons which may have led a majority of Britons to vote to leave in 2016. Overall, the factors that may have played some role in the UK’s decision are rather complex and broad ranging. While migration fears were repeatedly cited as a key factor, official migration data don’t adequately explain the intensity of opinions this issue attracted in the UK. That said, job growth for EU nationals has remained positive for over a decade despite significant job losses for UK nationals during the Great Recession. The most recent employment and wage data show that increases in jobs for UK nationals have coincided with the fastest pay growth seen in over a decade at a time when the pace of jobs growth for EU nationals has fallen back. (False) perceptions and an exaggerated fear of migration in the context of the European refugee crisis, seem to have played a major role in the UK voters’ general stance towards migration. Demographic and socioeconomic factors were important as well. The breakdown of those who voted Leave in the EU membership referendum shows that the Leave voters tend to be older, have a lower educational attainment and live in poorer and underserved communities.
Content table:
- Introduction
- Voting results of the EU membership referendum
- Survey results: people’s motivation behind their vote
- The underlying factors: were fears fact or fiction?
- Conlusion
Read the publication below or click here to open the PDF.
Brexit continues to throw up surprises in terms of the United Kingdom’s ability (or rather, inability) to complete the European Union (EU) withdrawal agreement. In many respects, this is a continuation of a sequence of surprises and unexpected developments following the shocking outcome of the 2016 UK EU membership referendum. Many polls preceding the referendum pointed towards a majority for the continued participation of the UK in the EU. From a purely macroeconomic point of view, as a wide range of studies from the IMF and the UK Treasury have suggested, the loss of welfare gains that EU integration provides to British society would be very hard to compensate for in case of Brexit. However, it has become clear that reasons behind voting behaviour often extend past conventional macroeconomic metrics and give more weight to other broader socioeconomic considerations than standard economic analysis might imply.
While it is still not entirely clear exactly how, when or even if the UK will leave the EU, it is important to try to understand the underlying reasons which may have led a majority of Britons to vote to leave, both in terms of what they might suggest for the UK’s future relationship with the EU and as an indication of what the outcome of a second referendum might be if it were to be organised. Moreover and more generally, the underlying reasons for the UK referendum outcome could help to understand what sort of forces may act against further European integration and could even threaten an unravelling of the EU project. A clearer picture of the economic, social and political circumstances which led to a Leave campaign victory may help predict if there will be further serious secessionist movements in Europe and could suggest pathways to avoid increased divisions. A deeper understanding of why a majority of Britons believed a divorce from the EU would yield more benefits than disadvantages may also tell us whether the forthcoming Brexit deal will ameliorate the grievances given by those who voted Leave.
The UK referendum on EU membership in June 2016 resulted in a 51.9% share for the Leave side against a 48.1% share for Remain. However, these aggregate figures hide large differences in voting patterns across geographical areas, between age groups and between groups with different backgrounds and educational levels.
2.1 Geographical differences
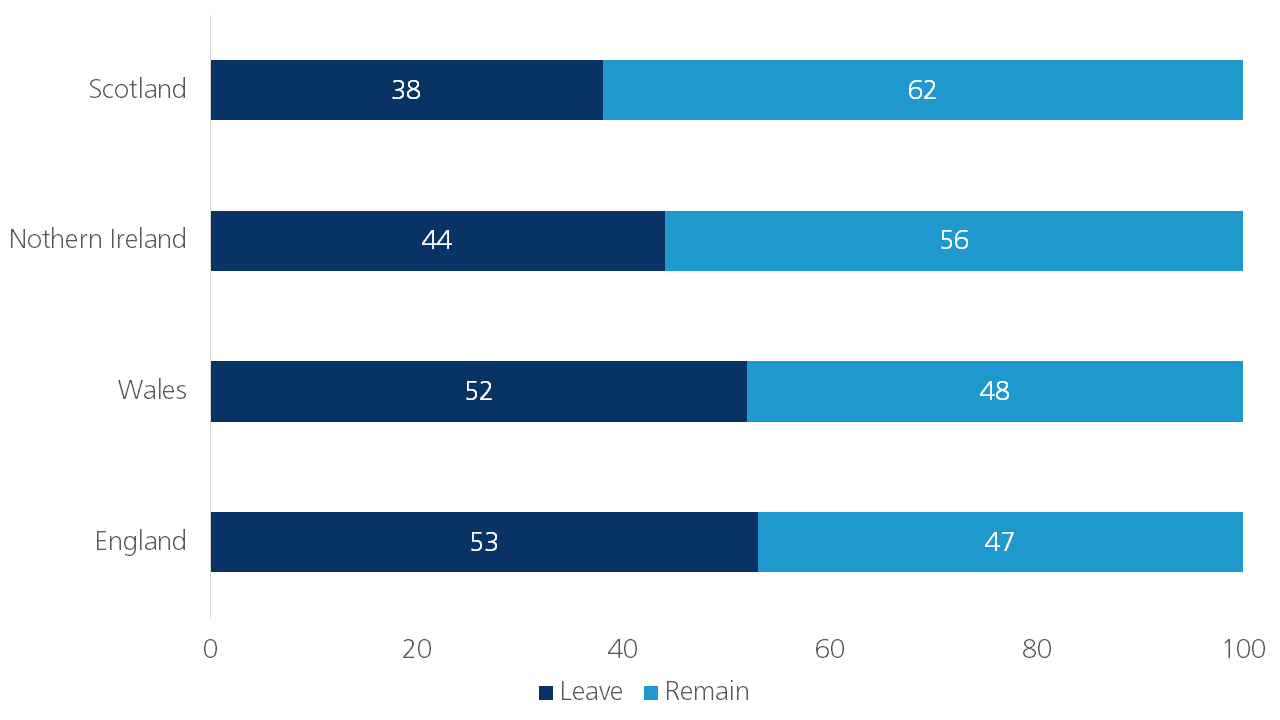
Differences in voting patterns across regions within the UK were large. London voters, for example, chose overwhelmingly to remain within the EU - almost 72% in Inner London. On the other hand, more than 65% of voters in Lincolnshire, an area dominated by agriculture, wanted the UK to leave the EU. In terms of national voting, England had the largest margin of victory for Leave, with those voting to leave coming to 53% versus Remain’s vote share of 47% (figure 1). Wales also had a majority of Leave voters, however its population is much smaller compared to England. Northern Ireland and Scotland, in contrast, had large Remain majorities. The decision to leave the EU was, hence, made in the regions of England outside of London. Except for four regions (e.g. Sussex), Leave won in every English district outside London (24 out of 28, with an average majority of 56.29% for Leave).
Some of these regional voting patterns were not very surprising. Northern Ireland’s proximity and close social and economic relationship with the Republic of Ireland, which will remain a member of the EU after Brexit, meant that the fallout of Brexit would be harmful in nearly all aspects. Past actions taken by Scotland to have more independence from the UK, as evidenced by the devolved Scottish Parliament established in 1999 and the 2014 Scottish independence referendum (which failed, but still signalled growing popularity in Scottish independence), also made a Remain majority in that region most likely. Other regional referendum outcomes had a less obvious underlying reason, which we will discuss later in the report.
Figure 1 – Brexit vote by nation (% share of total votes)
2.2 Demographic evidence
Older voters
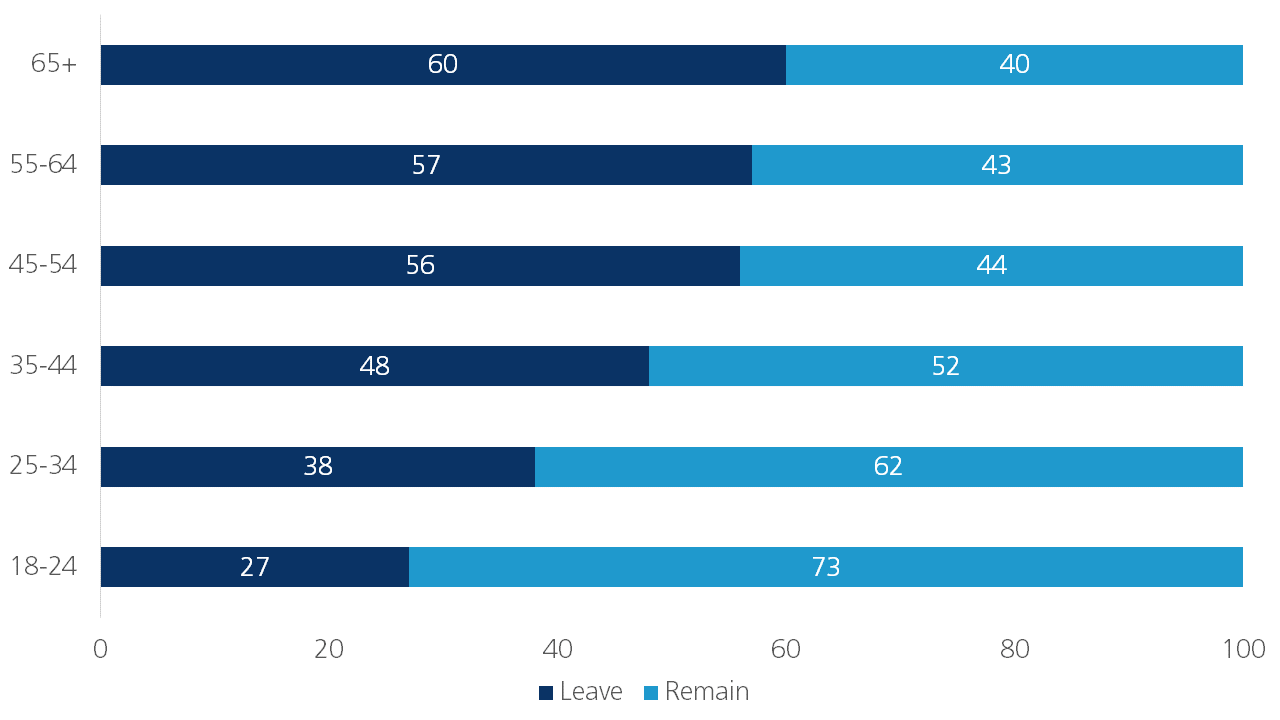
In general, post-referendum polls found that older voters were more likely to have voted Leave, while younger voters were more likely to have voted Remain. Based on data from the Lord Ashcroft Poll taken on June 23rd after voters had cast their vote, nearly three-quarters of 18 to 24 year-olds voted Remain, with this figure dropping to around two-thirds for those in the 25-34 age group (figure 2). Conversely, a majority of those 45 or older voted to leave, and 60% of those aged 65+ voted Leave. Interestingly, the survey also found that persons with children aged ten or under voted Remain, while persons with children aged 11 or older voted Leave, suggesting those with younger children (who are likely to be of younger age themselves) may be considering their children’s future as well as their own.
Figure 2 – Brexit vote by age group (% share of total votes)
The fact that older people are more likely to turnout for elections compared to younger people weighted the referendum results towards Leave as well. For the UK-EU referendum, voter turnout skewed largely in favour of older voters. According to work done by the London School of Economics and Opinium, 90% of those over 65 turned out to vote. This is much higher than the turnout of 64% for 18-24 year-olds, 65% for 25-39 year-olds, 66% for 40-54 year-olds and 74% for the 55-64 bracket.
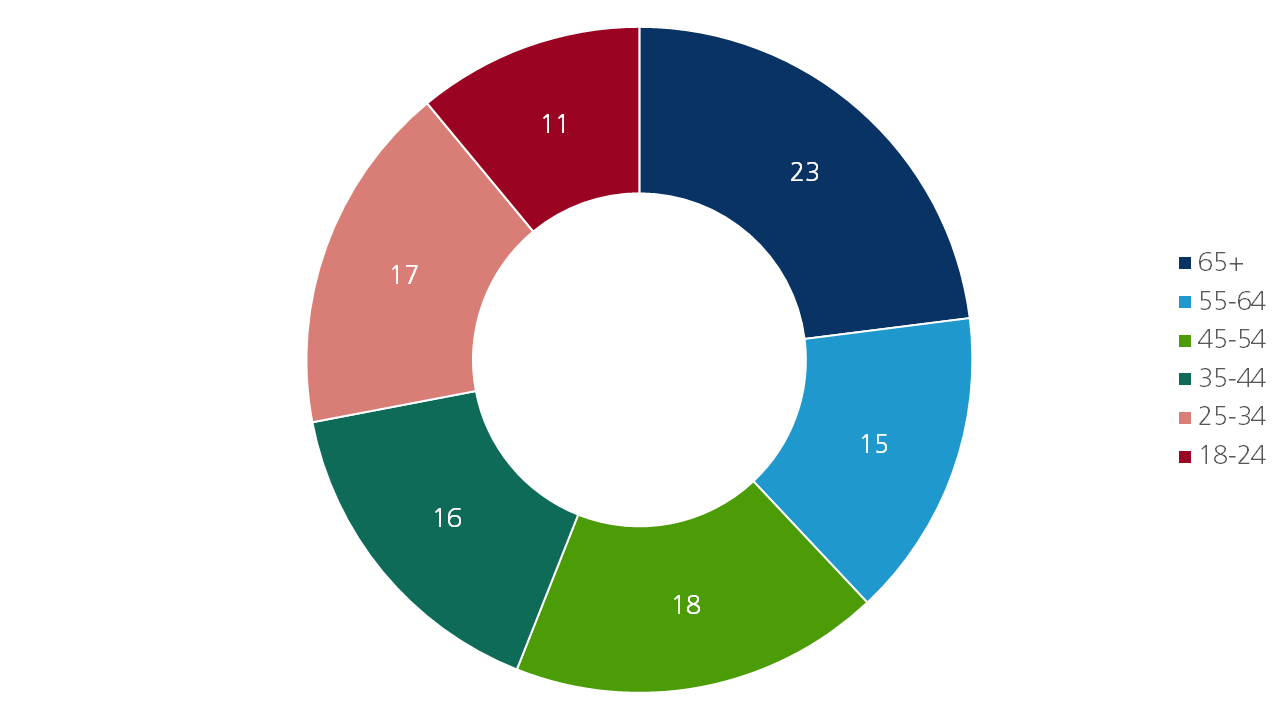
To compound matters, those aged 65 or older make up nearly a quarter of the population, while those aged 55 or older account for nearly 40% of the population (figure 3). The large proportion of older voters was also augmented by concerns surrounding health care and social security, as older people are the biggest recipients of these benefits. This likely motivated them to turnout for the UK EU referendum. For example, one of the main promises that the Leave campaign made was that voting to leave the EU would allow for increased spending on the NHS of £350mn a week. Despite the fact this figure was a misleading one that used a gross contribution figure rather than a net figure (i.e. after the UK rebate is deducted), these claims were widely believed by older Leave voters.
Remainers have often claimed that older people voted nostalgically, rather than logically, for a Britain prior to 1973; one that existed before the UK joined the European Economic Community (EEC). However, analysis by Campos and Coricelli (2015) posited that, among other political reasons, the UK joined the EEC as a way to avoid its economic decline. The authors found that UK’s per capita GDP relative to the EU founding members’ declined steadily from 1945 to 1972, but from 1973 onwards it has remained relatively stable.
Figure 3 – Age group proportion of the population (2015, % share of total population)
Lower educational attainment and working class voters
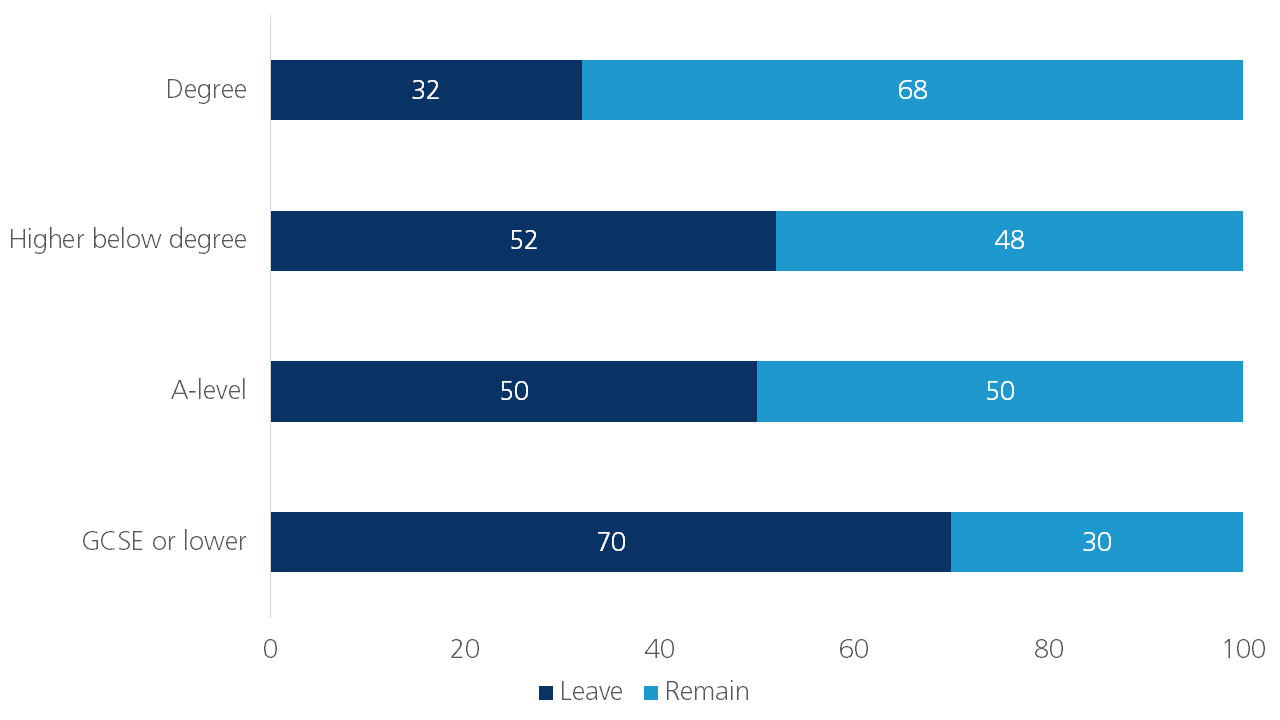
Drawing again from Lord Ashcroft Polls data, a majority of those with a university degree (57%) and a higher degree (64%) voted to Remain, along with 81% of persons currently enrolled in full time education. Conversely, a majority of those whose formal education ended at secondary school or earlier, voted to Leave. YouGov polling found similar figures, with its data stating that 68% of voters with a university degree wanted to remain in the EU, while 70% of voters with only a General Certificate of Secondary Education (GCSE) or lower voted to leave (figure 4). The BBC also reported that of the 30 areas with the fewest graduates in the UK, 28 backed Brexit, while 29 out of the 30 areas with the most graduates voted Remain.
In terms of socioeconomic class, which is correlated with educational attainment, polling data show that the AB social group (e.g. the upper middle and middle class, comprised of managerial, administrative or professional workers) were the only social group among whom a majority voted to Remain (57%), while nearly two thirds of C2DEs (64%), which contains skilled and unskilled manual workers, pensioners and the unemployed, voted to Leave. YouGov survey results give similar breakdowns.
Figure 4 - Brexit vote by educational attainment (% share of total votes)
Voters in underserved communities
Economists at the University of Warwick produced a comprehensive analysis on who voted for Brexit at the district level and consider a range of socioeconomic factors. Becker et al (2017) found that the share of the population in rented council housing, which the authors use as a measure of those potentially under increased pressure from migration of largely low-skilled Eastern European migrants, has a strong positive correlation with the Leave share of votes.
They also found that local authorities experiencing more fiscal cuts were more likely to vote in favour of leaving the EU. The paper used the share of the workforce in public employment as a measure of availability of public services and found that where this share is lower, the Leave vote share is higher. The paper also used cancer patients’ waiting times as a proxy for the responsiveness of the public health system. The researchers found that in regions where the share of suspected cancer patients waiting for treatment for more than 62 days is larger, the Leave vote share is larger. Overall, this research suggests that communities that were underserved in terms of access to public services were more likely to vote Leave.
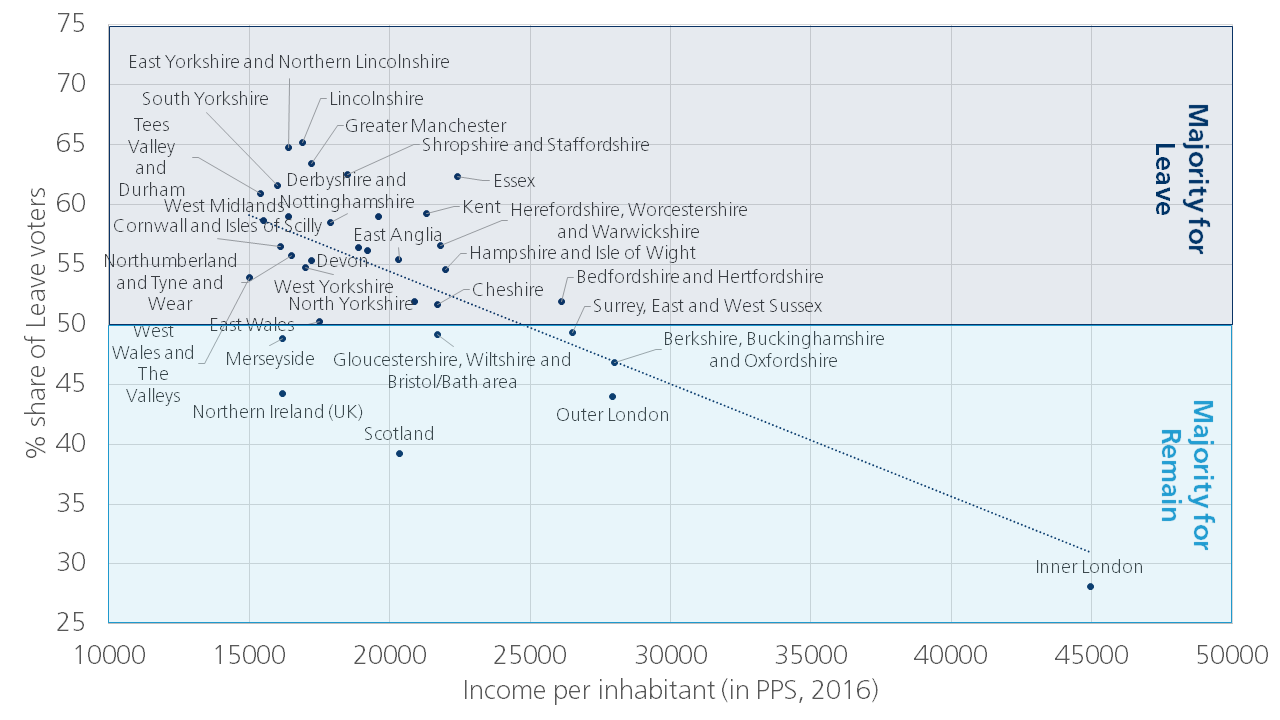
The link between a range of socioeconomic factors and the propensity to vote leave in the referendum can also be related to some longer-term structural changes in the UK economy. The share of Leave voters was strongest in some of the regions that prospered during the industrial revolution and afterwards weakened again due to de-industrialisation and globalisation such as Lincolnshire and Yorkshire (figure 5). The regions voting Remain have generally prospered in recent decades. The swift expansion of the services sector, and in particular financial and IT services, has supported their economic ascendance. The de-industrialisation trend and the move towards a service economy together with the increased power of capital via deregulations have benefitted some regions, while others lagged behind. This is reflected in the clear negative correlation between the share of Leave voters and income per inhabitant.
Figure 5 – Share of Leave voters versus income per inhabitant
White and English identity voters
As with many of the populist movements over the last several years, identity, particularly white identity, seems to have played a role. Lord Ashcroft Polls show that white voters voted to leave the EU by 53% to 47%, while 67% of those describing themselves as Asian and 73% of black voters voted to remain.
In the period leading up to the Brexit referendum, a wide range of polls asked voters why they were planning to vote for either Remain or Leave. The findings of these polls reached roughly the same results. In the Leave camp, several surveys point to immigration - and its impact on jobs and pay levels of UK nationals - and UK sovereignty as main factors that motivated people’s ‘Leave’ vote (table 1). In a study by the Centre for Social Investigation (2018), more than 70% of survey responders that voted Leave, stated that ‘I wanted the UK to regain control over EU migration’ was the most or second most important reason for their referendum choice. Besides migration, health care and social security, were also issues that were mentioned by voters as important factors that influenced their vote.
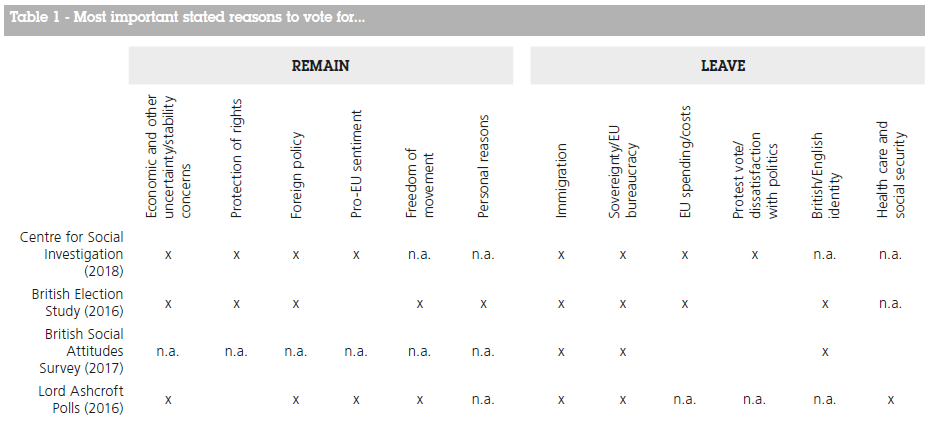
Remain voters, on the other hand, were mainly concerned about the negative impact of Brexit on the UK economy and about the uncertainty and potential instability it could cause. Concerns about the UK’s foreign policy position were also stated as supportive for the Remain voters. The large importance of the potential adverse economic consequences of Brexit as an argument to vote for Remain has probably been supported by the multitude of studies and publications on the topic, especially in case of a Brexit without a deal with the EU. Despite all evidence-based research by academic institutions and think thanks, potential economic damage was not a convincing argument for those who voted ‘Leave’ - a fact which remains in place to this day. As an example, a recent YouGov poll asking respondents whether they believe that a no deal Brexit would lead to very high debt in the UK, as was found by a study from the Institute for Fiscal Studies. The survey found that 56% of respondents aged over 65 - i.e. the same age group that mainly voted Leave in the Brexit referendum - said they didn’t believe a no-deal Brexit would probably lead to this outcome.
Hence, those who voted ‘Leave’, did so despite evidence-based research on the negative impact of leaving on conventional macroeconomic measures of economic performance such as GDP. However, as the paragraphs above illustrate, it might be argued that those voting leave came significantly from groups who already felt marginalised from the fruits of strong economic performance, such as those experiencing less access to public services or further education and this might render potential economic losses from Brexit less important to them. Instead, for these groups, “pure” Brexit arguments centred on ‘taking back control’ lost in the existing UK-EU relationship and highlighted issues such as sovereignty, avoiding EU bureaucracy and stopping UK financial flows towards the EU. These drivers were amplified by a more general sense of displacement and a loss of identity that emphasised considerations such as migration, dissatisfaction with and disconnect from political institutions and the ‘establishment’ These are often related to the context in which the referendum took place. More on the latter in part 4.3.
In this section, we evaluate whether the reasons to vote Leave, as put forth by the Leave campaign, are born out by the data.
4.1 Migration
One of the main issues for the EU membership referendum as stated by the Leave campaign was migration and freedom of movement. Freedom of movement for workers is one of four economic freedoms in the European Single Market. It gives EU citizens the right to move and reside freely between member states. Aside from some “asylum seeker” fears (also see part 4.3 on contextual factors), campaigners on the Leave side also believed that reducing inward migration from EU citizens would ease pressure in public services such as schools and hospitals, as well as free up jobs for British workers and allow for higher wages as labour supply decreased. This idea was also readily believed by many Leave voters.
Was the Leave campaign right on migration?
It is worth setting out the context in which migration and ‘taking control of our borders’ emerged as a factor in the referendum. In the mid-2000s, persons from the European Union and largely from the new accession States comprised the majority of new immigrants into the UK. In the years following the Great Recession, the declines in inward migration were due largely to a drop off in this group. Inward migration flows from the newer EU States picked up again in 2013, though over the course of 2013 and 2014 inward migration from all parts of the world increased. Following the result of the UK’s EU membership referendum in 2016, there have been consistent decreases from EU immigrants, but this has been somewhat offset by increased immigration from the rest of the world.
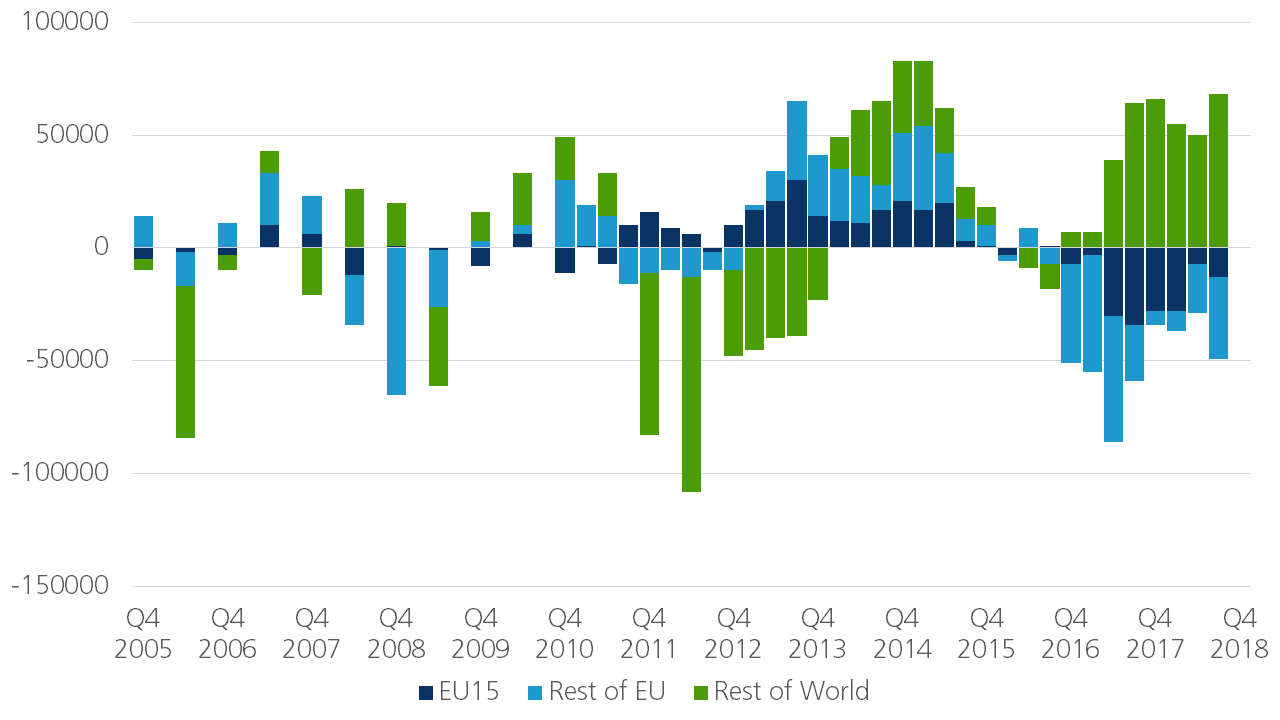
Outward migration data mirror this and show a sizable uptick in EU-27 citizens leaving the UK during the Great Recession, a large proportion of which were EU-27 less EU-15 citizens, and a decrease in outward migration as the economy improved. Overall, net migration over the time period available suggests that EU-27 citizens, particularly those from the newer accession countries, responded flexibly to economic conditions in the UK. Figure 6 shows that there were positive net flows of EU citizens into the country prior to the Great Recession, but this reversed when the economy crashed and only picked up as the UK economy recovered.
Figure 6 – Net migration into the UK by region of origin (change year-on-year, number of persons)
Have more jobs for EU citizens meant fewer jobs for UK nationals?
Jobs for EU-27 citizens have increased annually for nearly every quarter since these data were first collected in 2006. This was not the case for UK nationals, who shed jobs quickly during the Great Recession and in 2009 alone saw an average loss of 446k jobs.
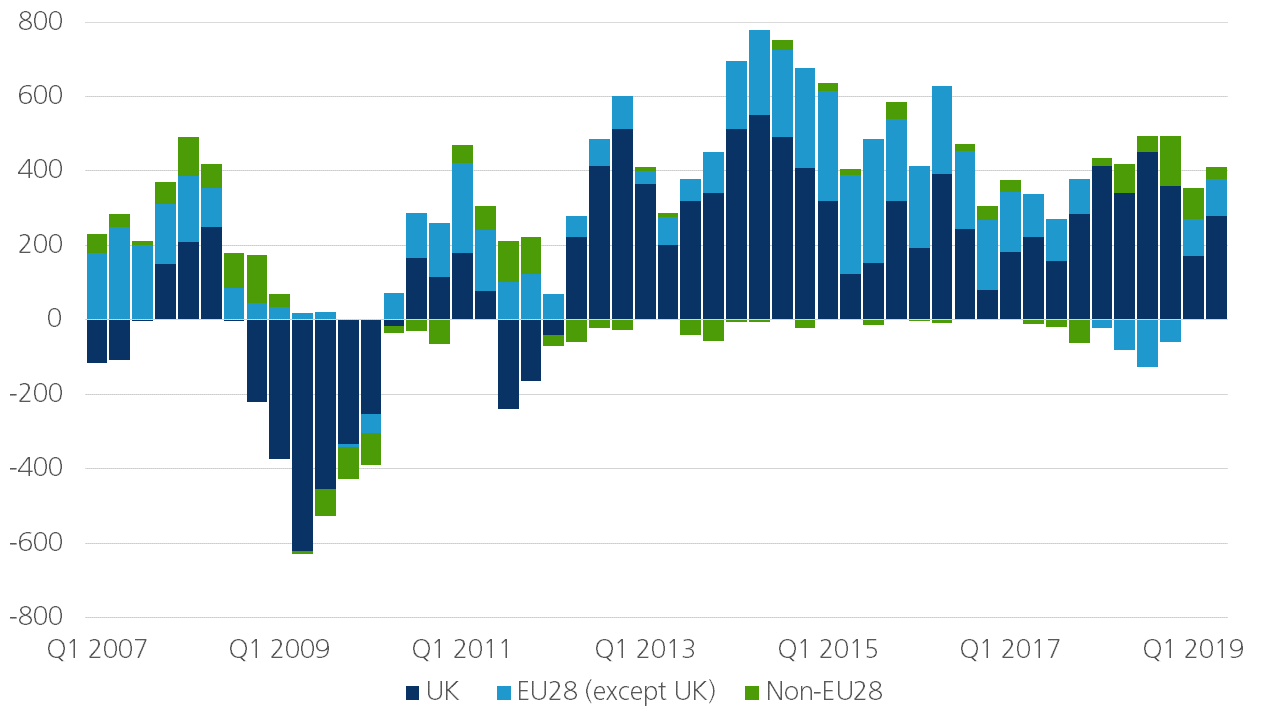
In order to assess the impact of the Brexit vote, it is helpful to look at data in the period before and after the EU membership referendum. The most recent annual data show that jobs growth of UK nationals aged 15 and older peaked at an average of about 491k jobs in 2014. Over the three years following that, the UK added on average around 223k jobs for UK nationals per annum. This compares with a peak in jobs growth for EU-27 nationals of about 279k in 2015, with an average increase in jobs for this group of about 167k per annum in the following two years. As shown in figure 7, jobs growth for UK nationals remained strong in 2018, with about an additional 392k jobs. This has slowed somewhat, with the first two quarters of 2019 showing average jobs growth for UK nationals of about 225k. Conversely, over the course of 2018 there was a decrease in EU-27 employment of about 73k, though this has rebounded to an additional 100k jobs on average in the first two quarters of 2019.
While a simple view of these data suggests that voting Leave in 2016 seems to have created more jobs for UK citizens, it is not necessarily the case that this is due to EU workers leaving the UK. Rather it could be due to strong consumption growth, which increased in 2016 at its fastest rate since 2005, but has recently eased over the last year or so likely due to Brexit uncertainty.
Figure 7 – UK employment by citizenship (absolute change year-on-year, in ‘000s of persons)
Has EU migration impacted UK pay?
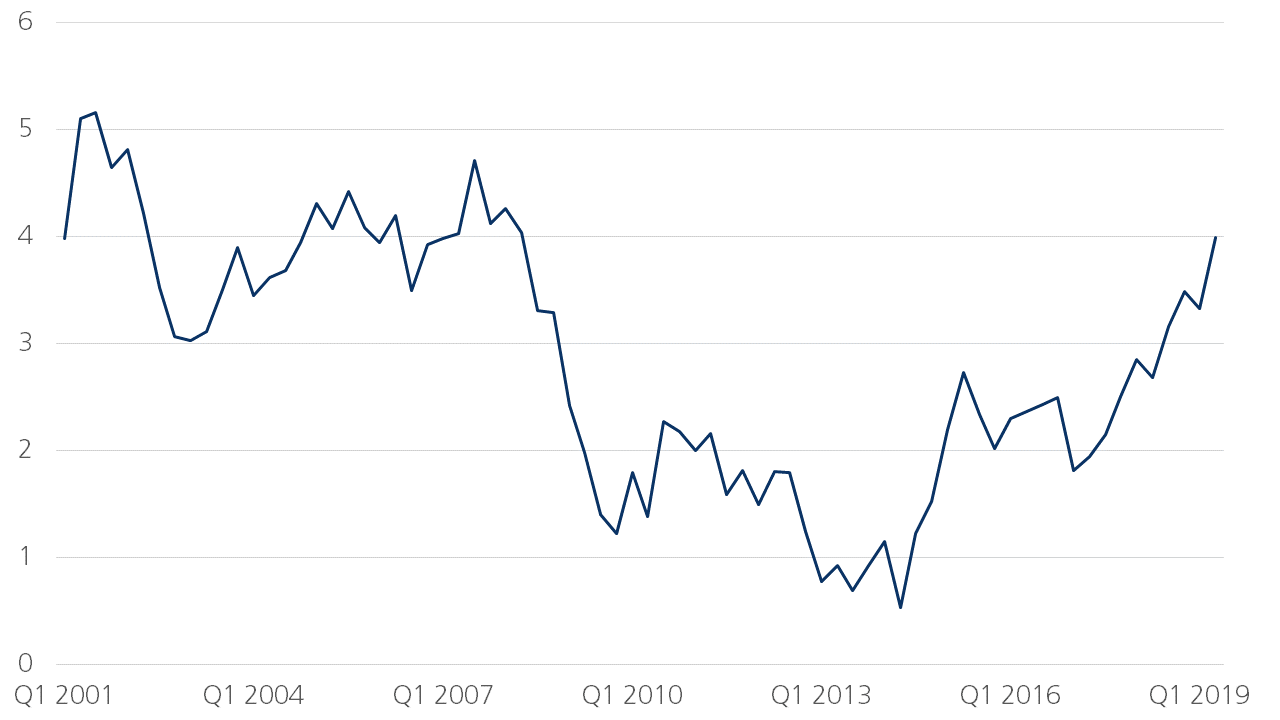
Assessing the impact of EU migration on wage growth in the UK is made almost impossible by the absence of a clear counterfactual. We can’t definitively say how wage growth would have developed if there had not been migration. What we can say is that migration flows largely reflect the strength or otherwise of economic conditions in the UK. If there had not been a flexible pool of workers from the EU, it is possible that wages would have risen faster during UK cyclical upturns but it is also possible that they would have fallen further in downturns in the absence of the safety valve of outward migration. In this context, annual growth in average weekly earnings (which is based on whole economy regular pay and excludes the volatile bonus component) stood at 3.7% yoy in 2008 (figure 8) - a year where the increase in employment by EU-27 nationals was nearly twice that of UK nationals. From 2009 to 2014 weekly earnings growth slowed considerably to 1.4%, but incomes began to pick up, with average weekly earnings growing by 2.3% in 2015. This trend has continued and in the second quarter of 2019, average weekly earnings grew by 4.0% yoy - the strongest rate of growth since 2008.
These figures suggest that pay in the UK was growing before the EU membership referendum, and has strengthened further since 2016. Additionally, average weekly earnings posted a more than 10-year high in the second quarter of 2019, which coincides with a pick-up in UK national workers of about 279k and EU-27 national workers of about 99k. These figures muddy the waters in terms of assessing the scale of the impact that EU workers had on wages.
Figure 8 – Average weekly earnings (total economy, SA, % change year-on-year)
4.2 Income inequality and living conditions
Living conditions are another important factor that likely influenced the way people voted at the referendum. In general, living conditions of the UK population are relatively good. GDP per capita in the UK has grown faster than in comparable EU economies since the European single market began in 1992 (also see the Economic Research Report of 20 March 2019). The unemployment rate has been trending down since 2011 and was already around historical lows in June 2016. In terms of poverty, measured by the percentage share of the population aged 18-64y at risk of poverty or social exclusion1, the UK is below the EU-average and showing a declining trend in recent years after the post-financial crisis rise.
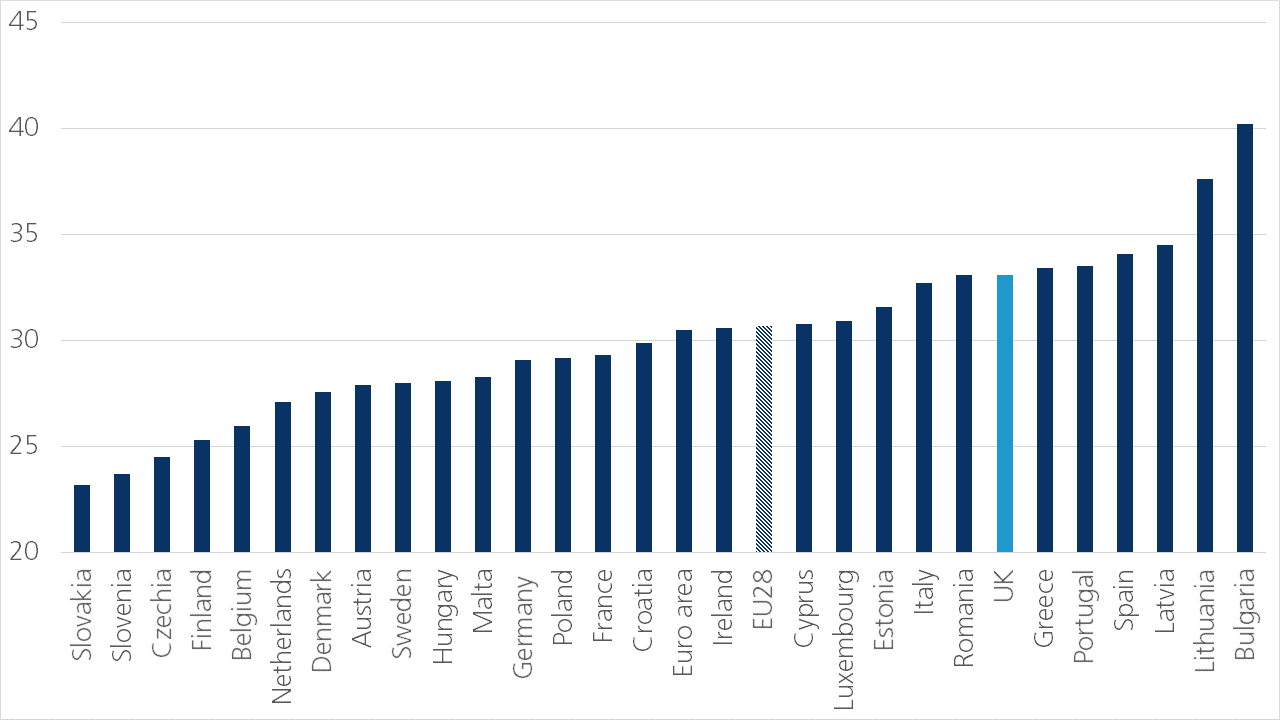
While on average UK living conditions have improved, the gains were not equally spread across society and between geographical regions. Income inequality in the UK is relatively high. As measured by the Gini coefficient, which compares cumulative proportions of the population against cumulative proportions of the income they receive, income distribution in the UK is more unequal than the EU average (figure 9). When ranking all EU countries in an ascending order of income inequality, the UK is ranked 7th highest among countries such as Italy, Romania, Greece and Portugal. Wealth is also unequally distributed in the UK. According to data from the ONS, in the period between July 2014 and June 2016, 43.8% of total wealth was owned by the top 10% of the population. In comparison, the bottom 10% owned only 0.1% of total wealth. While the UK has relatively high income and wealth inequality in comparison to other EU countries, this is not a recent development. Since income inequality data have been collected, the UK has always been less equal when compared to most other EU countries. In the years preceding the referendum, there wasn’t a clear uptrend either.
The government’s policy might have also been a determining factor. The Coalition Government’s Austerity programme that was first implemented in 2010, focused on deficit reduction. Studies from the Institute for Fiscal Studies (2016) have, however, shown that the introduced tax and benefit reforms under the Programme resulted in significant income losses for those of working age in the bottom half of the income distribution. Moreover, cuts to net service spending have tended to be larger in those areas that were initially more reliant on central government grants (IFS, 2015). It’s therefore likely that as a consequence of the austerity measures’ impact, the Leave campaign’s messages struck a more sympathetic note.
Figure 9 – Gini coefficient (scale from 0 to 100, higher Gini coefficient means more inequality, 2017)
4.3 Other contextual factors
It is important to note the general context in which the Brexit referendum took place. The UK population tends to have a rather low level of trust in the European Union as an institution and is in general relatively reluctant towards more centralised EU power compared to the other EU member states. Those feelings, however, are often based on misperceptions and false assumptions. Research done by ‘UK in a Changing Europe’ and Ipsos MORI (2016) in the weeks before the referendum pointed to significant misperceptions about the EU and its impact on life in the UK among the British population. For example, the study shows that the UK population massively overestimated how many EU-born people lived in the UK (EU citizens were estimated to make up 15% of UK population by survey respondents, while this was only 5% in reality). This was even more the case for people who intended to vote Leave. Moreover, a majority overestimated the amount the UK contributes to the EU budget. Meanwhile, the importance of inward investment from EU countries into the UK was underestimated. These research results indicate that there was a lack of accurate information provided to the public at the time of the referendum. However, exaggerations, scaremongering and even false facts during the referendum campaigns, peddled mainly by the Leave Campaign, led to ill-founded decisions.
The high stated importance of migration in the UK voters’ decision was likely also influenced by the challenges the EU was facing at the time of the referendum. In 2016, the European refugee crisis reached its peak with millions of refugees mainly from Syria, Iraq, and Afghanistan reaching EU shores. However, despite the fact that there wasn’t a spike in asylum applicants in the UK, as seen in Germany and Italy, these events likely played a role in the UK voters’ general stance towards migration.
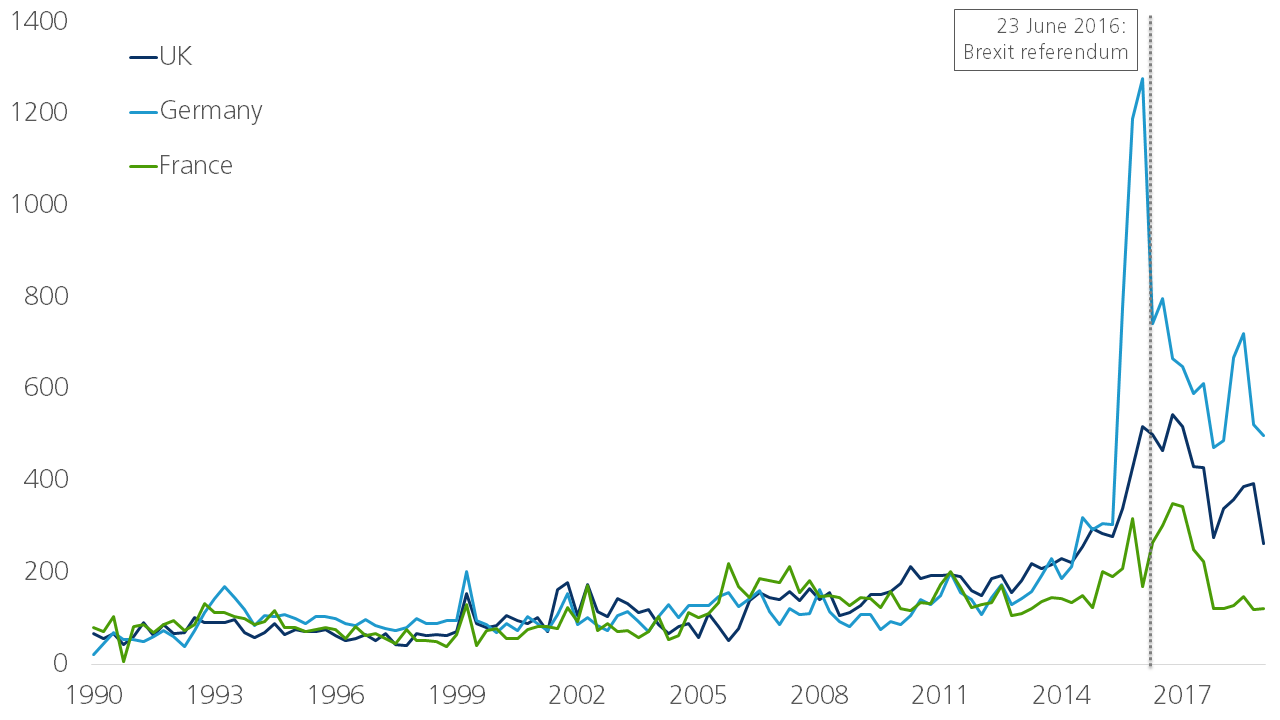
In the public debate there was likely also an exaggerated fear of migration in general. The Migration Fear Index constructed by Economic Policy Uncertainty illustrates this very well. The index is based on the number of newspaper articles that mention terms related to migration - such as border control, migration, asylum, etc. - and fear - such as anxiety, concern, violent, etc. This index reached peak levels in the period around the UK referendum, not only in the UK, but also in other European countries (figure 10). Since then, it has come down but the index is still at elevated levels compared to historical trends.
Figure 10 – EPU Migration Fear Index
The factors considered in this report underscore the complex and broad ranging set of influences that may have played some role in the UK’s decision to vote Leave in 2016. While migration fears were repeatedly cited as a key factor, official migration data don’t adequately explain the intensity of opinions this issue attracted in the UK. That said, job growth for EU nationals has remained positive for over a decade despite significant job losses for UK nationals during the Great Recession. The most recent employment and wage data for 2018 and 2019 show that increases in jobs for UK nationals have coincided with the fastest pay growth seen in over a decade at a time when the pace of jobs growth for EU nationals has fallen back.
Perhaps the one area where there is some clear evidence is demographic factors. Referred to as “The Left Behind” by Professors Matthew Goodwin and Robert Ford, these Leave voters tend to be “older, white, socially conservative voters in more economically marginal neighbourhoods”. The demographic breakdown of those who voted Leave in the EU membership referendum supports this theory. This trend has been seen not only in the UK, but in the US and across Europe over the last several years. This factor can be summarised by a quote from Inglehart and Norris’s 2016 paper on the economic have-nots and cultural backlash: “Less educated and older citizens, especially white men, who were once the privileged majority culture in Western societies, resent being told that traditional values are ‘politically incorrect’ if they have come to feel that they are being marginalized within their own countries.”
Footnotes
1 At risk of poverty or social exclusion corresponds to the sum of persons who are (Eurostat definition):
- at risk of poverty: an equivalised disposable income (after social transfer) below the at-risk-of-poverty threshold, which is set at 60 % of the national median equivalised disposable income after social transfers
- or severely materially deprived: a state of economic strain and durables, defined as the enforced inability (rather than the choice not to do so) to pay unexpected expenses, afford a one-week annual holiday away from home, a meal involving meat, chicken or fish every second day, the adequate heating of a dwelling, durable goods like a washing machine, colour television, telephone or car, being confronted with payment arrears (mortgage or rent, utility bills, hire purchase instalments or other loan payments)
- or living in a household with a very low work intensity: living in a household where the members of working age worked less than 20 % of their total potential during the previous 12 months.
References
Arnorsson, A. and Zoega, G., 2016. "On the Causes of Brexit," Birkbeck Working Papers in Economics and Finance 1605, Birkbeck, Department of Economics, Mathematics & Statistics.
Ashcroft, M. (2016) How the UK voted on Brexit, and why
https://lordashcroftpolls.com/2016/06/how-the-united-kingdom-voted-and-why/
Ashcroft, M. (2019) How the UK voted on Brexit, and why – a refresher
https://lordashcroftpolls.com/2019/02/how-the-uk-voted-on-brexit-and-why-a-refresher/
BBC (2016) EU Referendum Results
https://www.bbc.com/news/politics/eu_referendum/results
Becker, S. et al (2017) Who voted for Brexit? A comprehensive district-level analysis, Economic Policy, Volume 32, Issue 92, Pages 601–650
https://doi.org/10.1093/epolic/eix012
British Election Study (2016) What mattered most to you when deciding how to vote in the EU referendum?
https://www.britishelectionstudy.com/bes-findings/what-mattered-most-to-you-when-deciding-how-to-vote-in-the-eu-referendum/#.XalUZ3duIy9
Campos, N. and Coricelli, F. (2015) Why did Britain join the EU? A new insight from economic history
https://voxeu.org/article/britain-s-eu-membership-new-insight-economic-history
Carl, N. (2018), CSI Brexit 4: Reasons Why People Voted Leave or Remain, Centre for Social Investigation.
Elming, W. and Hood, A. (2016), Distributional analysis, Institute for Fiscal Studies,
https://www.ifs.org.uk/publications/8206
Ford, R. and Goodwin, M. (2015) Revolt on the Right: Explaining Support for the Radical Right in Britain. Book.
Inglehart, R. and Norris, P. (2016) Trump, Brexit, and the Rise of Populism: Economic Have-Nots and Cultural Backlash
https://research.hks.harvard.edu/publications/getFile.aspx?Id=1401
Innes, D. and Tetlow, G. (2015), Central cuts, local decision-making: changes in local government spending and revenues in England, 2009-10 to 2014-15, Institute for Fiscal Studies, Briefing Note BN166
https://www.ifs.org.uk/publications/7617
Ipsos MORI (2016), The Perils of Perception and the EU
https://www.ipsos.com/ipsos-mori/en-uk/perils-perception-and-eu
London School of Economics and Political Science, EU referendum: breaking indifference, How age affected voting
http://www.lse.ac.uk/about-lse/connect/connect-2017/eu-referendum-breaking-indifference
NatCen Social Research (2017) British Social Attitudes 34 - The vote to leave the EU
https://bsa.natcen.ac.uk/media/39149/bsa34_brexit_final.pdf
YouGov (2016) How Britain Voted
https://yougov.co.uk/topics/politics/articles-reports/2016/06/27/how-britain-voted
YouGov (2019) Survey - Do you believe that a no deal Brexit would lead to very high debt? Plus, mental health, and library books results
https://yougov.co.uk/opi/surveys/results#/survey/f1770079-e9ae-11e9-ba58-0bdda1f1785a/question/2e1a3a35-e9af-11e9-b6df-9f3f3d2800db/age