The rise of electric cars in Europe
Explanation of differences in sales between countries

- 1. Electric car sales figures
- 2. Potential explanatory factors
- 3. Setting up our own empirical analysis
- 4. Results of the econometric analysis
- 5. Some concluding remarks
Read the publication below or klick here to open PDF

Abstract
Electric cars are becoming progressively more popular and account for an increasing share of total car sales in Europe. This is partly because car manufacturers are gradually offering more choice with a wider range of models. However, we still see large differences in sales between European countries. In some countries, the share of electric cars in sales is still very low at only a few percent, while in other countries that share is already significantly high at around one in three cars sold, or even more. In this KBC research report, we attempt to explain the country differences in electric car sales using a broad set of demand factors. Our statistical analysis first shows that, across countries, a set of highly correlated factors (GDP per capita, charging station density, average fleet age, and climate awareness) are also strongly correlated with the share of electric cars in total car sales. Secondarily, the degree of home ownership, the average distance travelled by car and, although less obviously significant, the subsidy offered by the government when installing charging infrastructure, also appear to help explain country differences in electric car sales.
Sales of full-electric cars are on the rise in Europe. According to the latest figures from the European Automobile Manufacturers’ Association (ACEA), the share of battery electric vehicles (BEV) in total passenger car sales in Europe in the period January-September 2023 was already 15.2%.1In the same period a year earlier, it was 12.1%. Thus, this car type overtook diesel car sales (still only 12.3%) and became the third most popular choice, after gasoline cars (36.6%) and hybrid-electric cars (HEV, 26.0%). The share of plug-in hybrid-electric cars (PHEV) during the period under review was 7.4%, down slightly from a year earlier (8.3%). As of September 2023, the market shares of electric cars in Europe were 16.1% for BEV, 28.7% for HEV and 7.9% for PHEV, respectively.
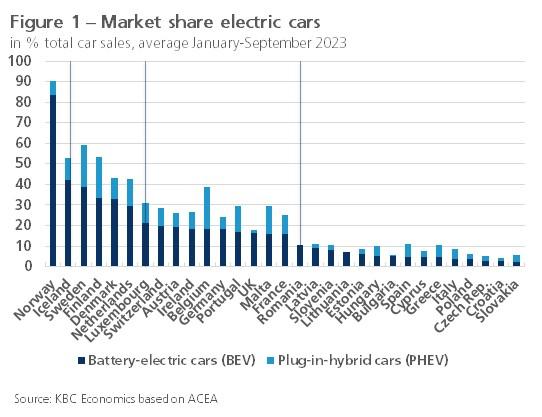
Despite the growing success of electric cars in Europe as a whole, the differences in sales between individual countries remain very large. Figure 1 shows the share of "plug-in" cars (BEV and PHEV) in total sales in January-September 2023 in 31 European countries. We can distinguish four groups. Norway is clearly an outlier, where total sales almost already consist entirely of electric cars (83% BEV and 7% PHEV). Then there is a group consisting of the other Scandinavian countries supplemented by the Netherlands, where the share is also already substantial (namely roughly 1/3rd BEV and over 1/10th PHEV). In a third group, which includes Belgium, BEV have a 15-20% share supplemented by 5-10% PHEV. Note that Belgium has a fairly large share of PHEV. Finally, there is group of Southern and Eastern European countries, where the share of electric cars (both BEV and PHEV) in sales is still very low at below 10%.
In this research report, we attempt to explain the large differences between European countries. The generally strong growth of electric car sales in Europe as a whole is obviously driven in part by the ever wider availability of BEV models. In principle, on BEV supply there are not such large international differences and hence we need to look for differences on demand factors. In section 2, we first list the potential reasons why people may or may not opt for electric driving. These are factors found in recent literature on the topic, which is limited to explanations of electric car adoption in specific individual countries. 2 In section 3 we list the variables used in our own analysis. In section 4, we test whether these variables effectively explain sales differences across countries by means of an econometric regression. To our knowledge, such comparative empirical analysis across countries has not been done before. Section 5 of the report provides some concluding remarks.
2. Potential explanatory factors
Despite rising sales, there remain factors specific to electric cars that deter or make people hesitate to purchase that type of car. These are mainly the generally still high price and the limited availability of cheaper models. The low driving range and the associated “range anxiety” (fear of not reaching one's destination) also deter many people. As such, these car-specific factors are quite similar in European countries and do not directly explain differences in sales. However, they can indirectly help explain the differences. For example, citizens in more affluent countries (with a higher average income level) can more easily afford the still relatively expensive electric cars. In addition to income differences, the average age of the existing vehicle fleet can also give an indication of the affordability of electric cars. In countries where this age is low, citizens are relatively quicker to buy a new car, and it is probably easier to buy an electric car. Differences in electricity prices between countries may also play a role in the relative affordability of electric cars. Especially recently, European countries' support policies in the context of the energy crisis have led to very different situations regarding electricity prices for households.
The problem of range anxiety will differ between countries as the presence of charging stations also varies. After all, an extensive and publicly accessible charging infrastructure is primordial for the growth of electric mobility. Note that here the ”chicken and egg” problem plays a role: on the one hand, the market penetration of electric cars will be limited until sufficient charging points are available, and on the other hand, investments in infrastructure require a sufficiently large presence of electric cars. Specific living and housing conditions of citizens may also be important here. In countries with a high population density and a high proportion of citizens living in cities, the rollout of public charging infrastructure and the fluidity of electric driving (e.g., fewer miles) is likely to be easier. In addition, private charging stations may well be installed more quickly and widely in countries where home ownership is higher and apartment living lower. Indeed, homeowners may be more willing and apartment dwellers less able to install a charging station.
Differences between countries on population characteristics and behaviours may also offer an explanation. Young adults and college-educated people tend to be early adopters of new technologies and applications. The lower the average age and the higher the average level of education of citizens, the higher the penetration rate of electric cars may be.3 Furthermore, the average distance driven with the car may also play a role. Given the even lower driving range of BEVs compared to gasoline and diesel cars, we can assume that in countries where average distances are shorter, citizens may be more inclined to switch to an electric car. In addition, this propensity may also depend on the extent to which citizens are awake to environmental and climate concerns. An electric car emits significantly less CO2 and particulate matter over its lifetime than fossil fuel cars. Surveys show significant international differences in climate change awareness. This may help explain the differences in market share of electric cars.
To achieve their ambitious sustainability goals, governments are paying increasing attention to stimulating electric driving. The aforementioned European Automobile Manufacturers’ Association (ACEA) provides an annual overview of the incentives in the various European countries.4 The extent as well as the manner in which these incentives are offered appears to vary widely. The differences between countries are related to tax incentives and/or subsidies for buying or owning an electric car, sometimes also for installing charging infrastructure. The incentives are mostly aimed at electric cars bought by private individuals, but in many countries (including Belgium) they also cover electric company cars.
3. Setting up our own empirical analysis
Although we intuitively feel that the above factors may play a role in explaining country differences in electric car sales, it ultimately remains an empirical question. In this section of the research report, we comment on the design of our own empirical exercise and list the variables we will include. Since HEV and PHEV cars are in transition from fossil to electric, we limit the analysis to full-electric cars (BEV). Our exercise is a simple cross-sectional analysis where the data used relate to a single period. For the dependent variable - the share of BEV in total car sales (EVSALE) - this is the period January-September 2023. For the explanatory variables (see following paragraphs), these are the latest available data in each case. In total, we include 31 countries in the exercise which are the 27 EU member states extended with Norway, Iceland, Switzerland and the UK.
On affordability, we consider as explanatory variables: (1) GDP per capita (GDPCAP, nominal in EUR, 2022, in logarithm to reduce outliers, source: Eurostat) and (2) the average age of the existing car fleet (CARAGE, in years, 2021, source: ACEA). The proposition is that people in countries with a high GDP per capita and/or a low average age of the car fleet are more likely to buy electric cars, and vice versa.
Regarding characteristics specific to the BEV market, we take as explanatory variables: (1) the number of charging points (EVCHAR, per capita, 2023 H1, source: ACEA), (2) the average electricity price for households (EVELEC, per kWh in EUR, 2022, source: Eurostat), and (3) the existence of a tax benefit or subsidy on the purchase or ownership of a BEV or on the installation of charging infrastructure (2023, source: ACEA). For the latter, we use dummy variables that take the value 1 if the benefit is present and the value 0 if not. Five possible tax benefits or subsidies are considered: (1) a tax benefit when purchasing a BEV (EVTBUY), (2) a tax benefit when owning a BEV (EVTOWN), (3) a tax benefit in case of a corporate BEV (EVTCOMP), (4) a subsidy when purchasing a BEV (EVSBUY), and (5) a subsidy when installing charging infrastructure (EVSINF).
Regarding living and housing conditions, we consider the following explanatory variables: (1) the extent of homeownership (HOMOWN, in % of population, 2022, source: Eurostat), (2) the extent to which the population lives in an apartment (LIVAPP, in %, 2022, source: Eurostat), (3) population density (POPDEN, persons per km², 2022, source: Eurostat), and (4) the extent to which the population lives in cities (LIVCIT, in %, 2022, source: Eurostat). The proposition of (1) and (2) is that people who do not have their own home or live in an apartment are less likely or in a position to install their own charging station and are therefore less likely to purchase a BEV. The proposition of (3) and (4) is that with high population density and a high proportion of citizens living in cities, the rollout of a public charging infrastructure and the smoothness of electric driving are likely to be easier.
Finally, we also consider as explanatory variables some characteristics and attitudes of the population: (1) the average age (POPAGE, in years, 2022, source: Eurostat), (2) the level of education (POPEDU, % of the population with at most lower secondary education, 2022, source: Eurostat), (3) the average distance driven by car (POPCAR, in km per day, 2022, source: Eurostat), and (4) the climate awareness among the population (POPCLI, spring 2023, source: Eurobarometer survey EC).5 The proposition of (1) and (2) is that citizens at a young age and with a higher level of education buy electric cars relatively faster and more. The proposition of (3) and (4) is that when shorter distances are travelled by car on average and citizens are more climate conscious, more electric cars are bought.
4. Results of the econometric analysis
In section 3, we listed variables that we believe can explain country differences in electric car sales. A statistical analysis, specifically using an econometric regression, should give an answer as to whether this is indeed the case. One point to note is that against the large number of potential explanations there is only a limited number of observations (i.e., 31). Hence, there is a risk that there are not enough 'degrees of freedom' available in the regression, which could make the results unreliable. Therefore, we first check for each variable via the calculation of Pearson correlation coefficients whether they are correlated with the variable to be explained (EVSALE). In case no (significant) correlation is found, this is already an indication that the variable in question does not provide an explanation. In that first univariate preselection, we are not too strict with rejection and keep a p-value of 0.20 in the significance test. In a second step, we conduct a multivariate regression analysis by backward selection. That is, we incrementally remove from the regression equation the variables left over from the pre-selection if they still turn out not to contribute significantly to the explanation. We do this until we are left with a set of explanatory variables that are all significant.
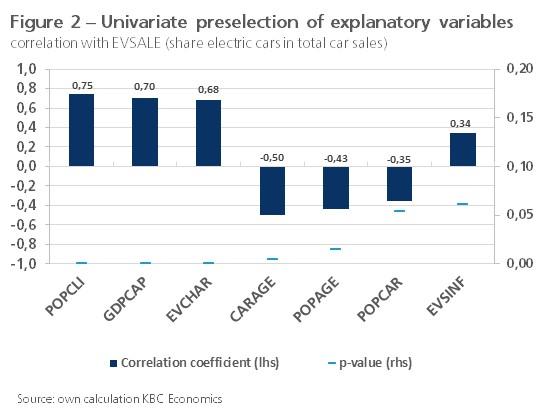
Figure 2 shows the results of univariate preselection. Five of the seventeen potentially explanatory variables have a correlation coefficient with a p-value smaller than the (strict) significance level 0.05.6 These are the degree of climate awareness among the population (POPCLI), the BEV affordability proxy indicators (GDPCAP and CARAGE), the presence of charging stations (EVCHAR) and the average age of the population (POPAGE). These variables are thus ideally suited to be included in the multivariate regression analysis. Two additional variables have a correlation coefficient with a p-value just above the significance level of 0.05. These are the average distance driven by car (POPCAR) and the subsidy offered by the government when installing charging infrastructure (EVSINF). All seven potentially explanatory variables shown in Figure 2 have the a priori expected sign. In addition, there are three other variables that have a lower correlation coefficient with a p-value below the (less stringent) significance level of 0.20. These are homeownership (HOMOWN), the tax benefit in case of a corporate EV (EVTCOMP) and the extent to which the population lives in an apartment (LIVAPP).
In the regression analysis, we face the problem of multicollinearity. This occurs when two or more explanatory variables in the regression equation are highly correlated with each other, which reduces the reliability of the regression results. The correlation matrix shows that especially the variables that show the highest correlation with the variable to be explained (EVSALE, see Figure 2) are also quite strongly correlated with each other. In practice, therefore, these appear to measure pretty much the same thing. More precisely, countries that are relatively prosperous (i.e., have a high GDP per capita) also turn out to be the countries with a relatively low average age of the car fleet (i.e., a new car is bought relatively faster), a relatively extensive BEV charging infrastructure as well as a population that is relatively more climate conscious. And, as Figure 2 indicates, these are also the countries where the share of electric cars in sales is the highest.
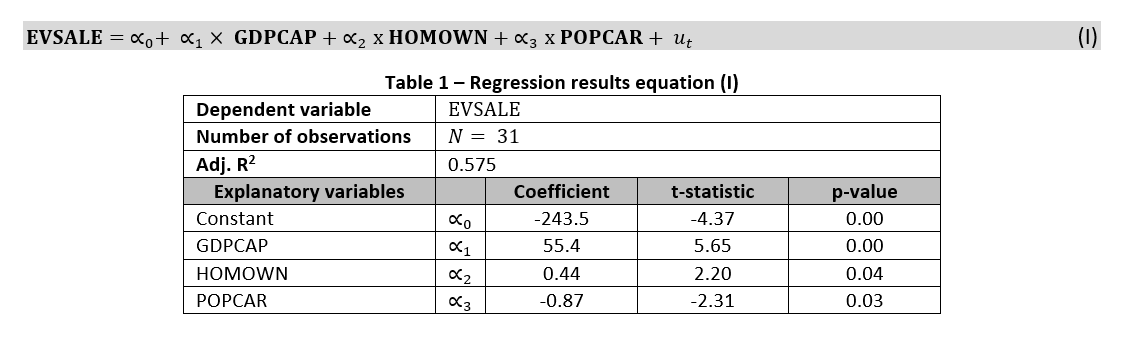
A solution to the problem of multicollinearity is to omit several strongly correlated explanatory variables, with the exception of one representative, from the regression equation. This makes it possible to examine whether other variables, in addition to those that are highly correlated with each other, also contribute a piece of the explanation. If we include GDP per capita (GDPCAP) in the regression as a representative variable for the group of correlated variables, only two variables turn out to be additionally significant in the regression equation. These are homeownership (HOMOWN) and average distance driven by car (POPCAR). The result of the regression equation (I) is then:
A limited additional explanation is provided if we include the government subsidy on the installation of charging infrastructure (EVSINF) as an additional variable in the regression equation. With a p-value just below the significance level of 0.20 (higher than the commonly used 0.05), this variable is, however, less strongly significant. The result of the further expanded regression equation (II) is:7
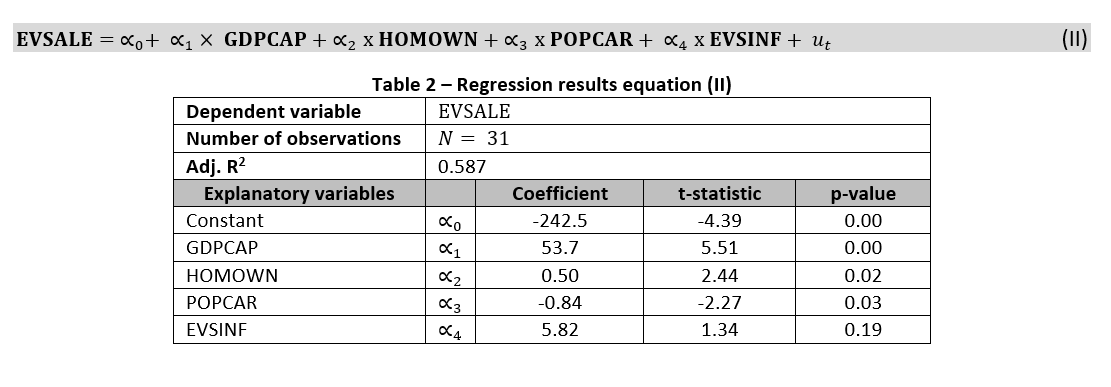
Our analysis shows that countries that are relatively affluent (i.e., have a high GDP per capita) also have a faster uptake of electric cars, and vice versa. However, a high (low) level of welfare also appears to be associated with a low (high) average age of the car fleet, a more (less) extensive BEV charging infrastructure, as well as a population that is more (less) climate conscious. Given the high correlation between all of these variables, it remains difficult to ascertain what more precisely in all of this effectively drives BEV sales. Is it primarily affordability or do one or more of the other highly correlated factors (fleet age, charging station density, climate awareness) play a role? Our analysis shows that homeownership and the average distance travelled by car also play a role: the higher (lower) the homeownership and the shorter (longer) the average trip by car, the higher (lower) the share of electric cars in sales.
The Nordic countries (Norway, Iceland, Sweden, Finland and Denmark) supplemented by the Netherlands are the countries in Europe where electric cars now account for about a third (much more in Norway) of total car sales (see Figure 1). These are all prosperous countries with a high climate awareness among the population as well as a relatively high charging station density (with the Netherlands and Norway emerging by a large margin as European "charging station champions"). The countries concerned also tend to have a low average age of the car fleet, but not always a high homeownership rate (it is rather low in Sweden, Finland and Denmark, but high in Norway) and/or a short average distance driven by car (it is rather high in Finland, but low in Sweden, Norway and the Netherlands).
Remarkably, we found no convincing evidence that government incentives for electric driving (tax reductions or subsidies) would help explain country differences in BEV sales (with the possible exception of subsidies for installing BEV charging infrastructure, for which the impact nevertheless is less clearly significant). For example, many countries in Southern and Eastern Europe (Spain, Greece, Czech Republic, Poland and Hungary) have incentives in several areas and yet the advance of electric cars there has so far been very limited. This could indicate that incentives make little sense and that their absence will not hinder the further increase in the share of electric cars. However, we should be cautious about drawing that conclusion. Indeed, our econometric exercise only takes the various forms of government stimulus into account in the form of dummy variables (i.e., the existence or absence of the benefit). Country differences in terms of magnitude of the incentive are not taken into account. In Belgium, for example, the advance of electric cars occurs mainly in the company car segment, which is no doubt strongly related to the greening of company car taxation. Quantifying in a variable the intensity of government incentives in the different countries is therefore a suggestion for further research.
References
ACEA (2023), “Tax benefits and purchase incentives: electric passenger cars in the 27 EU member states”, 8 p.
Giansoldati, M., Montre, A. en Scorrano, M. (2020), “Barriers to the adoption of electric cars: Evidence from an Italian survey”, Energy Policy 146 (1), 111812, https://doi.org/10.1016/j.enpol.2020.111812
Ipsos (2022), “EVBox Mobility Monitor”, juni, 76 p.
Mpoi, G., Milioti, C. en Mitropoulos, L. (2023), “Factors and incentives that affect electric vehicle adoption in Greece”, International Journal of Transportation Science and Technology, https://doi.org/10.1016/j.ijtst.2023.01.002
Sobiech-Grabka, K., Stankowska, A. en Jerzak, K. (2022), “Determinants of electric cars purchase intention in Poland: Personal attitudes versus economic arguments”, Energies, 15(9), 3078, https://doi.org/10.3390/en15093078
1 Europe is defined broadly here to include Norway, Iceland, Switzerland and the United Kingdom (UK) in addition to the EU27.
2 See, e.g., Giansoldati et al. (2020), Sobiech-Grabka (2022) and Mpoi et al. (2023).
3 See, e.g., Sobiech-Grabka et al. (2022) and Ipsos (2022). The Ipsos study shows that men also opt for electric cars more than women. Since countries do not differ in terms of proportion of men/women, that factor cannot explain country differences in electric car sales.[2] See ACEA (2023).
4 The degree of climate awareness refers to the percentage of respondents in the Eurobarometer survey who answered climate change to the question "Which of the following do you consider to be the single most serious problem facing the world as a whole?" Iceland, Norway, Switzerland and the UK are not included in the Eurobarometer survey. To still include them in our analysis, we produce our own approximate values for these four countries by linking the Eurobarometer to the Climate Change Readiness Index via a simple regression (source: ND-GAIN).
5 Usually p=0.05 is used as the limit of statistical significance. If p≤0.05, then the probability that the correlation found is due to chance (and we incorrectly reject the null hypothesis) is less than or equal to 5%. This is called "statistically significant”.
7 Note that only α2 in the equation can be interpreted as an elasticity (by how many percentage points the share of BEV in total sales increases if homeownership increases by one percentage point). α1 refers to a semi-elasticity, since GDP per capita is expressed in logarithm.