
Regional economic growth in Belgium
Impact of coronavirus crisis in 2020 broadly similar across the three regions of Belgium

Following the virtual disappearance between 2000 and 2008 of the differences in economic growth rates between the three regions of Belgium – Flanders, Wallonia and Brussels Capital Region – Flanders regained its systematic post-war lead in terms of economic growth after 2008. In the period since the financial crisis, between 2008 and 2019, real gross regional product in Flanders increased by an average of 1.3% per annum, compared with 0.8% and 0.6%, respectively, in Wallonia and Brussels. However, in 2019 (the most recent year for which figures have been published by the Belgian Institute for National Accounts (INR)), economic growth in Brussels (2.2%) outstripped that in both Flanders (1.7%) and Wallonia (1.6%). We do not yet have hard data for 2020 regarding whether and to what extent the pandemic has impacted differently on economic activity in the three regions. In this research report we attempt to shed more light on this, after first briefly mapping out the relative growth performance in the years before Covid-19. To estimate the impact of Covid-19, we draw on regional statistics on the sectoral breakdown of economic activity prior to the crisis, as well as on regional confidence and labour market indicators which are available for 2020. There are indications that the contraction in economic activity in the first half of 2020 was less severe in Brussels than in Flanders and Wallonia. On the other hand, Wallonia and especially Flanders have more recently benefited more from the partial recovery which began in the second half of the year. The recovery in consumption also appears to have been more sustained in Flanders in the second half of the year. On balance, the growth differentials between the three regions in 2020 may turn out to be fairly small. The sectoral differences in Belgium were undoubtedly more important than the regional differences. Real GDP growth for Belgium as a whole turned out at -6.2% for the full-year 2020. Our (admittedly approximate) estimate is that the contraction in Wallonia was of a similar order of magnitude, and in Flanders and Brussels a maximum of one percentage point greater and smaller, respectively. If this proves to be the case, this would mean that, for the second year running, Brussels has performed better (in 2020: less badly) than Flanders and Wallonia, enabling it to partially close the gap that had arisen relative to those two regions in recent years.
1. Introduction
The Belgian Institute for National Accounts (INR) published new figures for the Regional Accounts in Belgium at the end of January. They give an impression of how the three Belgian regions – Flanders, Wallonia and Brussels Capital Region – have performed relative to each other in the last few years in terms of economic growth, or growth of their ‘real gross regional product'. 1 These regional growth figures are only available on an annual basis (so no quarterly figures), and lag behind the publication of the national GDP figures. For Belgium as a whole, we now know that the Covid-19 crisis caused a contraction in real GDP of 6.2% in 2020. For the three regions, the historical figures only run as far as 2019, and it is not yet clear to what extent the impact of the pandemic on economic activity differed across the regions.
However, based on the national growth figure, which we do know, together with regionally available business cycle and labour market indicators for 2020, we can try to estimate the regional growth in that year. In the second part of this report we present a first (rough) attempt at this. To do this, we also draw on regional figures for the sectoral breakdown of economic activity prior to the crisis. To put our estimated regional economic performance figures for 2020 in a broader perspective, in the first part of this report we first explore the historical relative growth performance of Flanders, Wallonia and Brussels in the years before the Covid-19 crisis. The INR publishes the regional growth figures in accordance with the European System of National Accounts (ESA 2010) for the period 2003-2019. The older growth figures, prior to 2003, which are based on earlier accounting systems, are taken from the KBC Economics database. In the third part of the report we present a number of conclusions.
2. Regional growth before Covid-19
Flanders resumes its growth lead...
In the years following the financial crisis, namely between 2008 and 2019, gross regional product in Flanders, Wallonia and Brussels grew in real terms by an average of 1.3%, 0.8% and 0.6% per year, respectively. After the regional growth differentials in Belgium had virtually disappeared between 2000 and 2008, Flanders resumed its systematic lead in terms of economic growth which it had enjoyed relative to the two other regions before 2000 (Figure 1). A large part of the average difference in growth between Flanders and Wallonia in 2008-2019 can be explained by a different dynamic in economic activity during the financial crisis. The Great Recession of 2009 hit Wallonia harder, and the recovery and growth that followed was much weaker. Flanders continued to grow (modestly) during the sovereign debt crisis in the EU in 2012-2013, whereas the Walloon economy came to a virtual standstill (Figure 2).
.JPG/_jcr_content/renditions/cq5dam.web.960.9999.jpeg.cdn.res/last-modified/1672930203492/cq5dam.web.960.9999.jpeg)
.JPG/_jcr_content/renditions/cq5dam.web.960.9999.jpeg.cdn.res/last-modified/1672930191057/cq5dam.web.960.9999.jpeg)
The Brussels economy also marked time during the European debt crisis, but prior to that had emerged from the Great Recession of 2009 with less damage, thanks to the smaller share taken by industry in the local economy. Brussels also suffered relatively less from the sharp fall in international trade during the Great Recession. The most striking fact regarding Brussels, however, is its much lower growth on average than Flanders and Wallonia during the period of economic recovery between 2013 and 2019. In part this can be explained by the terrorist attacks on 22 March 2016 on Brussels Airport in Zaventem and the Brussels Metro. Both these events severely impacted on the hospitality, retail and leisure sectors, leading to negative growth for the Brussels economy in that year.
Figure 3 shows the differential in annual growth rates between Flanders on the one hand and Wallonia and Brussels, respectively, on the other, calculated as the four-year moving average so as to eliminate the high volatility in the statistics. While the growth gap between Flanders and Wallonia narrowed slightly in recent years, the differential relative to Brussels widened. Very recently, however, Brussels appears to be performing somewhat better once again: in 2019, the most recent year for which figures are available, economic growth in Brussels (+2.2%) was stronger than in the two other regions (+1.7% in Flanders and +1.6% in Wallonia) for the first time since 2012. This relatively strong growth was largely due to the dynamic in financial services.
...thanks to higher productivity and employment growth
Put simply, economic growth is the sum of employment growth and productivity growth. The fact that Wallonia and Brussels recorded weaker growth than Flanders again after 2008 was due in the first place to the loss of productivity growth in those two regions. It also fell sharply in Flanders, but remained positive at an average of 0.3% per year, albeit lower than the average across the euro area (Figure 4). Employment growth was also higher in Flanders after 2008, averaging 1.0% per year compared with 0.8% in Wallonia and 0.6% in Brussels (Figure 5). All three Belgian regions outperformed the euro area on this metric. This illustrates the fairly labour-intensive nature of the GDP growth in Belgium in the last decade, with high levels of job creation in the service sectors where labour productivity is lower than in industry.
.JPG/_jcr_content/renditions/cq5dam.web.960.9999.jpeg.cdn.res/last-modified/1672930202185/cq5dam.web.960.9999.jpeg)
.JPG/_jcr_content/renditions/cq5dam.web.960.9999.jpeg.cdn.res/last-modified/1672930193523/cq5dam.web.960.9999.jpeg)
The low average employment growth in Brussels in 2008-2019 compared with the other two regions also translated into a relatively weaker dynamic in the unemployment rate (the share of unemployed people in the labour force) and the activity rate (the share of working people in the working age population) (Figures 6 and 7). That at least was the case in 2014: both rates fell more during the financial crisis of 2008-2013. It is striking that the labour market situation in Brussels has improved spectacularly since then, narrowing the (admittedly still wide) gap with Wallonia and especially Flanders. Against the backdrop of the relatively weak economic growth in the Capital Region, this suggests that more and more residents of Brussels have recently been finding work outside the region.
.JPG/_jcr_content/renditions/cq5dam.web.960.9999.jpeg.cdn.res/last-modified/1672930192450/cq5dam.web.960.9999.jpeg)
.JPG/_jcr_content/renditions/cq5dam.web.960.9999.jpeg.cdn.res/last-modified/1672930198900/cq5dam.web.960.9999.jpeg)
.JPG/_jcr_content/renditions/cq5dam.web.960.9999.jpeg.cdn.res/last-modified/1672930194718/cq5dam.web.960.9999.jpeg)
3. Regional economic performance in 2020
Since regional figures are not yet available for 2020, we do not yet have a clear picture of the extent to which economic activity in the three regions of Belgium has been impacted by Covid-19. We can however try to shed some light on this by using figures for 2019 to examine the economic importance in the three regions of the sectors that were most badly affected by the pandemic in 2020. We can also draw on the various economic and labour market indicators for which figures have been published for 2020, some of them on a monthly basis.
Economic importance of most badly affected sectors
From the periodic surveys carried out by the Economic Risk Management Group (ERMG), we can see which sectors in Belgium suffered the biggest loss in turnover in 2020 due to the pandemic (this detail is not available down to regional level). If we define this loss as an average of more than 30% across all fifteen ERMG survey rounds in 2020, the affected sectors are as follows: 'Events and recreation’ (average loss -82%), 'Accommodation and food service activities’ (-75%); ‘Aviation' (-48%); 'Retail sales (non-food)' (-42%), 'Road transport (persons)' (-41%), ‘Manufacture of textiles’, ‘Manufacture of furniture’ and ‘Manufacture of transport equipment’ (-36%, -33% and -33%, respectively), and ‘Wholesale’ (-30%). The Regional Accounts contain a sectoral breakdown (up to 2019) which allows us to calculate the economic importance of each of the sectors in the total value added and the total number of working persons in the three regions2.
.JPG/_jcr_content/renditions/cq5dam.web.960.9999.jpeg.cdn.res/last-modified/1672930195319/cq5dam.web.960.9999.jpeg)
Figure 8 shows that the share of the sectors concerned in the total regional value added was higher in Flanders in 2019 (17.9%) than in Wallonia (14.8%) which in turn was higher than in Brussels (13.8%). This could indicate that the contraction in economic activity was highest in Flanders in 2020 and lowest in Brussels. However, the differences are not very large, and become even smaller if we view the importance of the sectors in terms of the number of people employed. We also have to be careful with statistics like these because they take no account of the economic dynamic of sectors which were unaffected or less badly affected by Covid-19. The national quarterly figures suggest a substantial recovery in economic activity in the second half of the year. That recovery was driven strongly by industry and exports, areas where Flanders, with its relatively open economy with relatively more larger companies, was arguably able to benefit more.
Although figures are not available broken down by sector, the ERMG does publish survey results for the regions on the aggregate loss of turnover for all companies together. Until the summer, Brussels suffered a smaller loss than Flanders and Wallonia (Figure 9). That is in line with the above finding that Brussels suffered the least under the crisis. The ERMG does however point out that the regional figures for the period up to August are unreliable (in the publication of more recent survey results, the old regional figures from before the summer were accordingly omitted), suggesting a lack of assurance about the regional representativeness of the respondents in the surveys. The more recent survey results only include respondents whose principal activity is located in the region in question, thus increasing their reliability. It is notable that Brussels companies have since seen a higher fall in turnover than their Flemish and Walloon counterparts.
.JPG/_jcr_content/renditions/cq5dam.web.960.9999.jpeg.cdn.res/last-modified/1672930198372/cq5dam.web.960.9999.jpeg)
Equally striking is that in the months prior to the second wave of the pandemic at the end of 2020, the reported loss of turnover by Flemish companies suddenly fell to much lower levels than for companies in the Walloon and Brussels regions. This appears to suggest that the powerful recovery in real Belgian GDP in the third quarter, after the sharp contraction in the first half of the year, was mainly attributable to Flanders. In the final months of the year, when new coronavirus measures took effect, the Flemish figures once again fell into line with those for Wallonia. As stated, the impact was greater in Brussels in the second half of the year. That can probably be ascribed to the lower share of industry in the Capital Region (2.5% of total value added, compared with 16.5% in Flanders and 14.7% in Wallonia), meaning that Brussels shared less in the national and international industrial recovery during the autumn.
Regional differences in confidence indicators
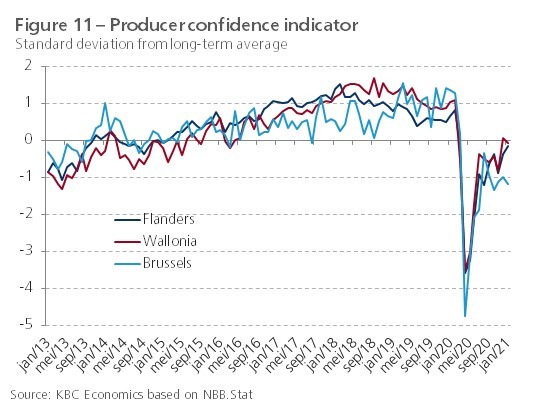
Traditional measures of economic performance, including consumer and producer confidence indicators, can help shed light on the relative course of regional economic activity in 2020 (Figures 10 and 11). Since there are substantial and lasting differences between the approximate time series for the three regions, we rescaled both indicators for each region as a standard deviation from the long-term average. Figure 10 shows that the correction in consumer confidence in Flanders in the first half of the year was virtually the same as in Wallonia and Brussels, but showed a faster and stronger improvement in the autumn. Confidence in Flanders is now roughly back to pre-crisis levels, which is not yet the case for the other two regions.
.JPG/_jcr_content/renditions/cq5dam.web.960.9999.jpeg.cdn.res/last-modified/1672930204226/cq5dam.web.960.9999.jpeg)
Like consumer confidence, producer confidence also rebounded. This time, it was mainly producer confidence in Brussels which lagged behind, and actually deteriorated again towards the end of the year. Producer confidence in Flanders and Wallonia improved to the long-term average, but not yet to pre-crisis levels. This picture corresponds with the findings of the ERMG survey discussed earlier. With a relatively smaller share of industry in its value added, the Brussels Capital Region benefited less than Flanders and Wallonia from the industrial revival which took shape in the autumn of 2020. Although Flanders has a more open economy than Wallonia, the confidence indicator component concerned with the assessment of the foreign order position showed a parallel trend in both regions.
Summarising, we can say that the confidence indicators suggest that consumption demand appears to be recovering faster in Flanders, but that on the business front, Flemish and Walloon companies are emerging from the coronavirus slump more or less in parallel, with Brussels lagging behind on both fronts. The relatively stronger recovery in consumer confidence in Flanders is also reflected more specifically in the component that measures consumer expectations concerning what will happen to unemployment over the next twelve months (Figure 12). In all three regions, this component predominantly points to a sharp increase in people’s already substantial fear of becoming unemployed, though this indicator did fall again more visibly in Flanders than in Wallonia and Brussels. The easing of the fears of unemployment is a key factor in reducing the precautionary tendency of households to increase savings, and thus in providing a boost for consumption
Labour markets holding up for the time being
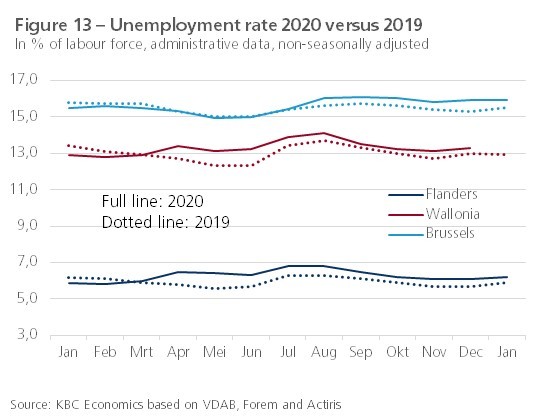
Although Covid-19 hit economic activity hard, the impact of the pandemic on the actual unemployment rate has thus far been relatively limited.3 The unemployment rate (based on administrative data) in the three regions was not much higher throughout 2020 than in the corresponding months in 2019 (Figure 13). Figure 6, which we discussed in the first part of this report, also shows the average annual unemployment rate in 2020 and illustrates that, viewed from a longer perspective, it rose to only a very limited extent.
The as yet limited rise in actual unemployment is also reflected in the dynamic of the number of non-working jobseekers who are registered with the regional employment services in Belgium (VDAB in Flanders, Forem in Wallonia and Actiris in Brussels Capital Region). Figure 14 shows the year-on-year change for this group (thus eliminating seasonal effects). In Flanders and Wallonia, this peaked in the spring of 2020. That could reflect the rather greater impact of the pandemic in these two regions (see earlier in this report), but there is also a statistical explanation (namely the sharp fall in the number of unemployed persons a year earlier, which occurred to a lesser extent in Brussels). The three regions ended 2020 with 6.5% (Flanders), 2.6% (Wallonia) and 4.1% (Brussels) more jobseekers than a year earlier. The series is however fairly volatile: in January 2021 (the most recently available figures), the year-on-year change in the three regions was 4.8%, 4.4% and 2.6%, respectively. The differences in the characteristics of the jobseekers in the three regions are more marked than the differences in the annual increases. While youth unemployment (people aged under 25) actually fell in Flanders, with the biggest increase in the number of jobseekers occurring among those aged between 35 and 55 years, in Wallonia and Brussels young people have thus far been the main victims of the coronavirus crisis on the labour market. This is of particular concern for Brussels, because it brought an end to nine successive years of falling youth unemployment.
.JPG/_jcr_content/renditions/cq5dam.web.960.9999.jpeg.cdn.res/last-modified/1672930203726/cq5dam.web.960.9999.jpeg)
.JPG/_jcr_content/renditions/cq5dam.web.960.9999.jpeg.cdn.res/last-modified/1672930200303/cq5dam.web.960.9999.jpeg)
The fact that the labour market in the three regions has so far held up reasonably well has been thanks to the rapid action taken by the government in rolling out support measures to limit direct job losses, including an expansion of the temporary unemployment system. During the peak, in April last year, the number of employees in that system in Flanders, Wallonia and Brussels was 0.79 million, 0.34 million and 0.11 million, respectively. Thereafter, the number fell back until September, but since then it has risen again on the back of the second wave of the pandemic at the end of the year. If we relate the number of people in the temporary unemployed scheme in each region to the number of residents of that region who were employed in the private sector in 2019, we find that the regional differences regarding use of the scheme are not very large (Figure 15). Nonetheless, the take-up of the temporary unemployment scheme by employees in the regions was slightly lower in Brussels than in the two other regions at the peak of the crisis, illustrating once again that the Brussels economy may have been less badly hit by Covid-19 in the first half of the year than the Flemish and Walloon economies. In November 2020, the most recent month for which figures are available, approximately 15%, 18% and 14% (rounded percentages) of residents employed in the private sector in Flanders, Wallonia and Brussels, respectively, were using the temporary unemployment scheme.
4. Concluding remarks
The information that is currently available to enable us to assess the impact of the Covid-19 crisis on economic activity in the three Belgian regions is still scarce and very fragmented. This makes it difficult to estimate to what extent growth in those regions in 2020 deviated from the growth rate for Belgium as a whole, which stood at -6.2%. There are however some indications that the contraction in economic activity in the first half of the year was slightly less steep in Brussels than in Flanders and Wallonia. On the other hand, Flanders in particular, but probably also Wallonia, have more recently benefited more from the partial recovery which took place in the second half of the year. This was due in part to the national and international recovery in industrial activity, but the recovery in consumption also proved to be more sustained in Flanders.
The somewhat different regional consequences of Covid-19 in the first versus the second half of the year probably cancel each other out, and we may therefore conclude that the differences between the three regions were broadly speaking probably not very large. The sectoral differences in the impact of Covid-19 in Belgium were undoubtedly more important than the regional differences. The finding that the estimated regional differences are fairly modest is also echoed in the Regional Economic Outlook published by the Federal Planning Bureau in July 2020. At that time, the Planning Bureau was forecasting an economic contraction of -10.5% due to the pandemic (we too initially assumed a much bigger impact than was ultimately the case). Regionally, the Planning Bureau was forecasting the contraction in 2020 for Flanders, Wallonia and Brussels at -11.1%, -10.3% and -9.3%, respectively.
The contraction in real GDP for Belgium as a whole turned out at -6.2% for the full-year 2020. Our first (admittedly very rough) estimate is that the contraction in Wallonia was broadly in line with that figure, and in Flanders and Brussels a maximum of one percentage point greater and smaller, respectively. If that proves to be the case, this would mean that, for the second year running, Brussels has performed better (in 2020: less badly) than Flanders and Wallonia, enabling it to partially close the gap that had arisen relative to those two regions in recent years. We will have to wait until the start of 2022 for definitive results.
1 Gross regional product is the gross domestic product (GDP) of a region within a country and corresponds to the total value added produced in the territory of that region
2 The sectoral categories in the Regional Accounts are however not entirely the same as those used in the ERMG survey. For ‘Events and recreation’ we have ‘Creative activities, arts and entertainment’, ‘Sport, leisure and recreation’, ‘Associations’ and ‘Travel agencies and organisers’.
For retail sales, there is no breakdown in the Regional Accounts into non-food
and food, and we are therefore forced to take retail sales as a whole. It
should also be noted that the ERMG surveys relate to the turnover of companies, which is not the same thing as their value added.
3 See also KBC Economic Opinions ‘Thunderstorm or clearing for the Belgian labour market?’ dated 8 February 2021.